Table of Contents
- What Is Quantitative Trading?
- How Does Quantitative Trading Work?
- The Role of Data in Quantitative Trading
- Quantitative Trading vs Traditional Trading
- Quantitative Trading vs Algorithmic Trading
- Common Types of Quantitative Trading Strategies
- Trend-Following Strategies
- Mean Reversion Strategies
- Momentum Strategies
- Statistical Arbitrage
- Breakout Strategies
- Quantitative Trading in Forex Markets
- Why Traders Use Quantitative Trading
- Reduced Emotional Decision-Making
- Ability to Test Trading Ideas
- Faster Market Analysis
- Greater Consistency
- Important Metrics in Quantitative Trading
- What Is Backtesting?
- The Danger of Overfitting
- Programming Languages Used in Quantitative Trading
- Risk Management in Quantitative Trading
- Can Quantitative Trading Be Automated?
- Quantitative Trading and Artificial Intelligence
- Challenges of Quantitative Trading
- How Beginners Can Explore Quantitative Trading
- Is Quantitative Trading Profitable?
- The Future of Quantitative Trading
- Final Thoughts on Quantitative Trading
- Risk Disclaimer
Table of Contents
- What Is Quantitative Trading?
- How Does Quantitative Trading Work?
- The Role of Data in Quantitative Trading
- Quantitative Trading vs Traditional Trading
- Quantitative Trading vs Algorithmic Trading
- Common Types of Quantitative Trading Strategies
- Trend-Following Strategies
- Mean Reversion Strategies
- Momentum Strategies
- Statistical Arbitrage
- Breakout Strategies
- Quantitative Trading in Forex Markets
- Why Traders Use Quantitative Trading
- Reduced Emotional Decision-Making
- Ability to Test Trading Ideas
- Faster Market Analysis
- Greater Consistency
- Important Metrics in Quantitative Trading
- What Is Backtesting?
- The Danger of Overfitting
- Programming Languages Used in Quantitative Trading
- Risk Management in Quantitative Trading
- Can Quantitative Trading Be Automated?
- Quantitative Trading and Artificial Intelligence
- Challenges of Quantitative Trading
- How Beginners Can Explore Quantitative Trading
- Is Quantitative Trading Profitable?
- The Future of Quantitative Trading
- Final Thoughts on Quantitative Trading
- Risk Disclaimer
Quantitative trading has changed the way many traders approach financial markets. Instead of making every decision based on instinct, chart interpretation, or emotion, quantitative traders use data, mathematical models, statistics, and predefined rules to guide their decisions.
The idea is simple. A trading strategy identifies specific market conditions. Then, the trader uses data to determine whether those conditions have historically produced useful trading opportunities.
However, the process behind quantitative trading can become highly sophisticated.
Professional quantitative traders may analyze millions of data points. They can also use algorithms to monitor multiple markets at the same time. Some systems automatically identify opportunities, calculate risk, place trades, and manage positions.
Still, quantitative trading is not limited to large financial institutions.
Retail traders can also use quantitative concepts to create more structured trading strategies. Even basic rules based on price, volatility, momentum, or technical indicators can introduce a quantitative element into a trading plan.
In this guide, we will explain what quantitative trading is, how it works, the tools commonly used, its potential advantages, its risks, and how traders can begin exploring a more data-driven approach.
What Is Quantitative Trading?
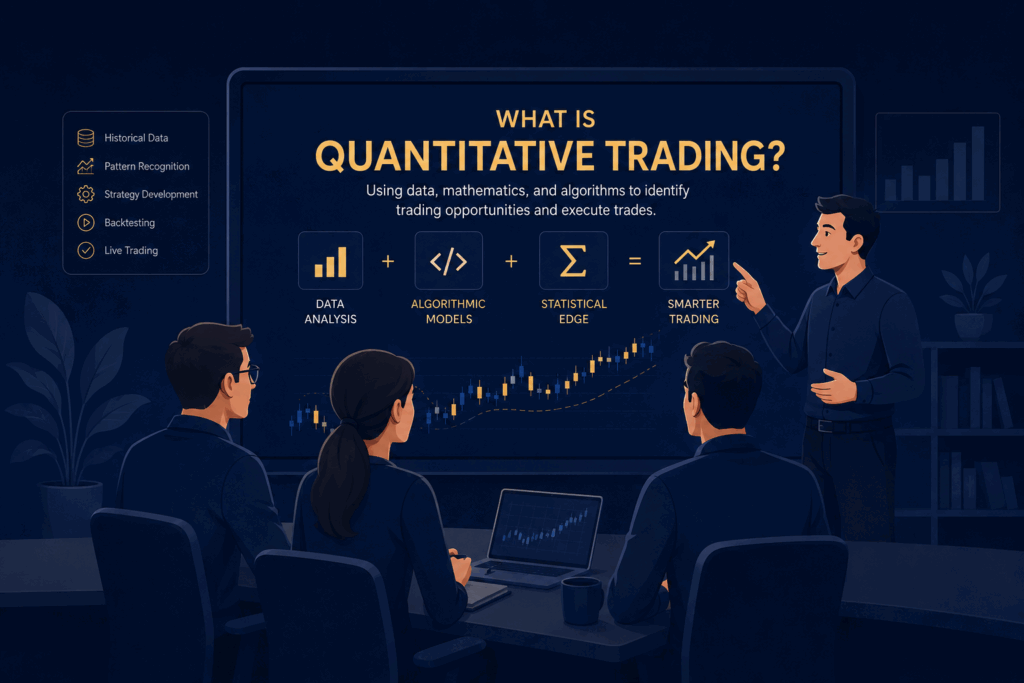
Quantitative trading is a method of trading financial markets using mathematical calculations, statistical analysis, data, and predefined rules.
Instead of asking, “Does this chart look like a good trade?” a quantitative trader might ask:
- What conditions must exist before a trade is opened?
- How often has this setup occurred historically?
- What percentage of those trades were profitable?
- What was the average gain?
- What was the average loss?
- How large was the maximum drawdown?
- How did the strategy perform in different market conditions?
The goal is to make trading decisions measurable.
A quantitative strategy may use simple rules or highly advanced mathematical models.
For example, a basic strategy might buy an asset when a short-term moving average crosses above a longer-term moving average.
A more advanced quantitative trading system may analyze:
- Price movements
- Trading volume
- Volatility
- Correlations
- Market liquidity
- Economic information
- Order flow
- Historical patterns
- Statistical relationships between assets
The system then looks for conditions that match its trading model.
How Does Quantitative Trading Work?
Most quantitative trading strategies follow a structured process.
First, the trader develops an idea.
Next, the idea is converted into clear rules.
Historical data is then used to test those rules. This process is known as backtesting.
If the results appear promising, the trader may continue improving the strategy before testing it in current market conditions.
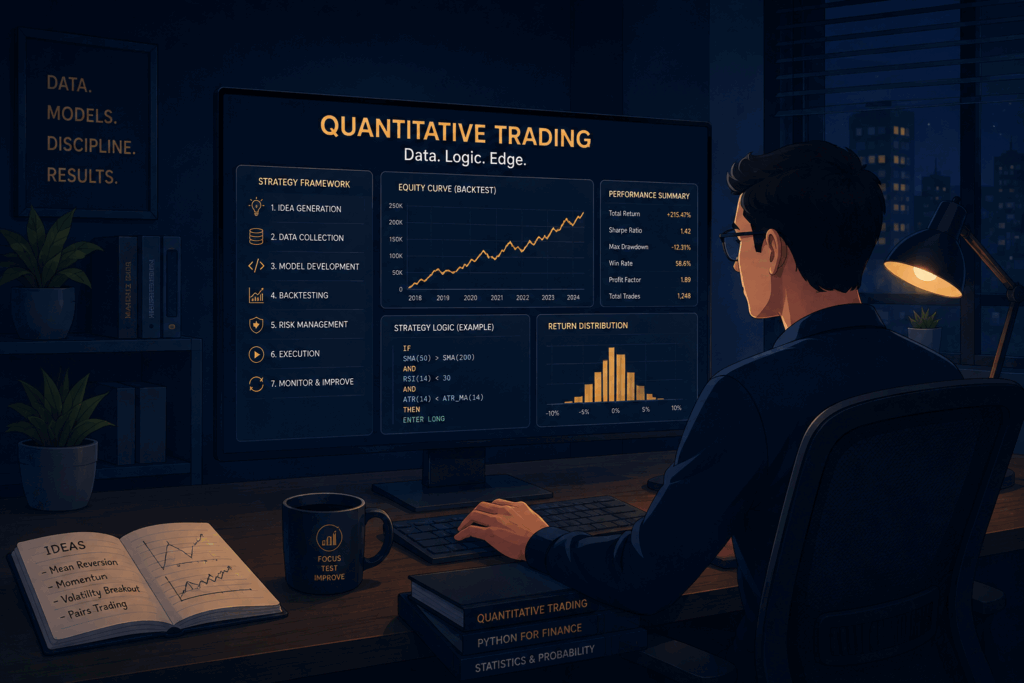
A typical quantitative trading process may include the following stages:
- Create a trading hypothesis.
- Collect relevant market data.
- Develop specific trading rules.
- Backtest the strategy.
- Analyze risk and performance.
- Adjust the model when necessary.
- Test the strategy in live market conditions.
- Monitor the system over time.
Every stage matters.
A strategy that performs well during one period may behave very differently when market conditions change.
Therefore, quantitative trading requires continuous testing and monitoring.
The Role of Data in Quantitative Trading
Data is the foundation of quantitative trading.
Without reliable data, even a sophisticated model can produce misleading results.
Quantitative traders may use several types of information depending on the strategy.
Historical Price Data
Historical prices are among the most common data sources.
This information can include:
- Open prices
- High prices
- Low prices
- Closing prices
- Trading volume
- Bid and ask prices
Traders can analyze this data to identify patterns and test strategies.
Volatility Data
Volatility measures how much an asset moves over a particular period.
Some quantitative strategies perform better when volatility increases. Others are designed for quieter markets.
Therefore, volatility can become an important part of trade selection and risk management.
Fundamental and Economic Data
Some quantitative trading models use economic information instead of relying only on price.
Examples include:
- Interest rates
- Inflation
- Employment data
- Economic growth
- Company earnings
- Market sentiment indicators
The model may attempt to identify relationships between these factors and future price movements.
Alternative Data
More advanced quantitative strategies sometimes use alternative information.
This could include online search activity, news sentiment, social media data, satellite information, or other non-traditional sources.
However, alternative data usually requires more advanced tools and careful analysis.
Quantitative Trading vs Traditional Trading
Traditional discretionary trading often depends heavily on the trader’s personal interpretation of the market.
A discretionary trader may study charts, support and resistance levels, economic events, or market sentiment before making a decision.
Quantitative trading takes a different approach.
Instead of relying primarily on judgment, it attempts to translate trading ideas into specific rules.
For example, a discretionary trader might say:
“The market looks oversold, so I think the price could rise.”
A quantitative trader may define the same idea more precisely:
“Open a long position when a specific momentum indicator falls below a defined level, volatility remains within a certain range, and another confirmation condition is met.”
The second approach can be tested.
That is one of the biggest differences between quantitative and purely discretionary trading.
Quantitative Trading vs Algorithmic Trading
Quantitative trading and algorithmic trading are closely related, but they are not exactly the same.
Quantitative trading focuses on using mathematical models and data to identify trading opportunities.
Algorithmic trading focuses on using computer programs to execute predefined trading instructions.
A quantitative strategy can be executed manually.
Likewise, an algorithm can execute a relatively simple trading rule that does not require a complex quantitative model.
However, the two areas frequently overlap.
Many modern quantitative trading strategies use algorithms because computers can analyze large amounts of data and respond faster than a human trader.
Common Types of Quantitative Trading Strategies
There is no single quantitative trading strategy.
Instead, traders develop models around different market behaviors.
Trend-Following Strategies
Trend-following systems attempt to participate in sustained price movements.
The basic idea is that an asset already moving strongly in one direction may continue moving in that direction for a period.
A model might analyze:
- Moving averages
- Price breakouts
- Momentum indicators
- Trend strength
- Volatility
The strategy then uses predefined rules to determine when a trend may be strong enough to enter.
Trend-following strategies can work well in directional markets. However, they may experience frequent losing trades when markets move sideways.
Mean Reversion Strategies
Mean reversion strategies are based on the idea that prices sometimes move away from their typical range and later return toward an average.
For example, a quantitative model may compare the current price with a historical moving average.
If the price moves unusually far away from that average, the model may identify a potential mean reversion opportunity.
However, prices do not always return quickly.
Sometimes, what appears to be a temporary deviation can become the beginning of a strong trend.
Risk management remains essential.
Momentum Strategies
Momentum strategies attempt to identify assets showing strong price movement.
The model may rank several assets based on recent performance.
It may then focus on markets with the strongest momentum.
Quantitative momentum strategies can use several timeframes and indicators.
However, sudden reversals can create significant risk.
Statistical Arbitrage
Statistical arbitrage attempts to identify temporary pricing relationships between related financial instruments.
For example, two assets may historically move together.
If their relationship temporarily changes, a quantitative model may identify a possible opportunity.
These strategies can become mathematically complex and often require substantial data analysis.
Breakout Strategies
Breakout systems look for prices moving beyond previously established ranges.
A quantitative breakout strategy may define:
- The length of the historical price range
- The minimum breakout size
- Required volatility
- Entry conditions
- Stop-loss rules
- Position size
- Exit conditions
Because all conditions are predefined, the strategy can be tested across historical data.
Quantitative Trading in Forex Markets
Quantitative trading is commonly associated with forex because currency markets generate large amounts of price data and operate across multiple global sessions.
Forex quantitative strategies may examine:
- Currency pair momentum
- Volatility
- Interest rate differences
- Trading session behavior
- Price correlations
- Economic announcements
- Historical price patterns
For example, a quantitative model might analyze whether a particular currency pair behaves differently during the London, New York, or Asian trading sessions.
Another model could study whether volatility increases during specific periods.
However, historical behavior does not guarantee that the same pattern will continue.
Market conditions constantly evolve.
Why Traders Use Quantitative Trading
Quantitative trading has several characteristics that make it attractive to traders who prefer structured decision-making.
Reduced Emotional Decision-Making
Emotions can influence trading decisions.
Fear may cause a trader to exit too early. Greed may lead someone to hold a position too long.
A quantitative strategy uses predefined conditions.
Therefore, decisions can become more consistent.
However, traders can still interfere with a system after losses or unexpected market movements. Discipline remains important.
Ability to Test Trading Ideas
One major advantage of quantitative trading is the ability to test ideas using historical data.
A trader can examine how a strategy might have behaved over hundreds or thousands of historical trades.
This information can reveal:
- Win rate
- Average profit
- Average loss
- Maximum drawdown
- Profit factor
- Number of trades
- Performance during different periods
Backtesting cannot predict the future, but it can help traders understand how a strategy behaved historically.
Faster Market Analysis
Computers can analyze information much faster than humans.
A quantitative system can potentially monitor many instruments at the same time.
This can be useful when a strategy needs to identify specific conditions across several markets.
Greater Consistency
A clearly defined system applies the same rules repeatedly.
That can reduce inconsistent decision-making.
For example, the system does not avoid a trade simply because the previous position lost money.
If the next setup meets the rules, the strategy can continue following its process.
Important Metrics in Quantitative Trading
A strategy should not be evaluated only by total profit.
Several performance metrics can provide a more complete picture.
Win Rate
Win rate measures the percentage of profitable trades.
However, a high win rate does not automatically mean a strategy is profitable.
A system could win frequently but experience occasional large losses.
Risk-to-Reward Ratio
This compares the potential amount lost on a trade with the potential gain.
A strategy with a lower win rate may still perform effectively if winning trades are significantly larger than losing trades.
Maximum Drawdown
Maximum drawdown measures the largest decline from a previous account peak.
This is an important risk metric.
Two strategies could produce similar returns while having very different drawdowns.
Profit Factor
Profit factor compares gross profits with gross losses.
A value above one means historical profits were greater than historical losses.
However, traders should consider this metric alongside other statistics.
Sharpe Ratio
The Sharpe ratio is commonly used to compare returns with volatility.
It can help traders evaluate risk-adjusted performance.
Still, no single metric provides a complete picture of strategy quality.
What Is Backtesting?
Backtesting is the process of applying trading rules to historical market data.
For example, suppose a trader creates a strategy based on moving averages.
The backtest can simulate how the strategy would have performed during previous market periods.
The trader can then analyze the results.
A useful backtest should consider factors such as:
- Trading costs
- Spreads
- Slippage
- Available liquidity
- Entry timing
- Exit timing
- Position sizing
Ignoring these elements can make a strategy appear more profitable than it may have been in real trading.
The Danger of Overfitting
Overfitting is one of the biggest risks in quantitative trading.
It happens when a strategy is adjusted too closely to historical data.
Imagine a trader changes dozens of parameters until a backtest produces excellent results.
The system may appear extremely effective.
However, it may simply be optimized for past market behavior.
When new data appears, the strategy can fail.
Therefore, quantitative traders often separate data into different periods.
One set can be used to develop the model. Another can be used to test whether the model works on data it has not previously seen.
Programming Languages Used in Quantitative Trading
Many quantitative traders use programming languages to analyze data and automate strategies.
Python is particularly popular because it provides extensive libraries for data analysis, statistics, and financial modeling.
Other languages can include:
- R
- C++
- Java
- MATLAB
- Julia
However, learning advanced programming is not always required to understand quantitative trading concepts.
A trader can begin by creating structured rules before moving into automation.
Risk Management in Quantitative Trading
A strong trading model still requires risk management.
No strategy wins every trade.
Additionally, market conditions can change suddenly.
Risk management rules may include:
- Maximum position size
- Maximum daily loss
- Maximum portfolio exposure
- Stop-loss conditions
- Volatility-based position sizing
- Limits on correlated positions
- Maximum acceptable drawdown
A quantitative strategy should define what happens when conditions do not behave as expected.
This is just as important as defining the entry.
Can Quantitative Trading Be Automated?
Yes.
Many quantitative strategies are automated.
Once the trading logic is programmed, a system can monitor markets and execute trades when predefined conditions are met.
Automation can reduce the need for constant manual monitoring.
However, automated systems still require supervision.
Potential problems include:
- Software errors
- Internet interruptions
- Broker connection problems
- Incorrect data
- Unexpected market gaps
- Extreme volatility
- Changes in market structure
Automation does not eliminate trading risk.
It simply changes how the strategy is executed.
Quantitative Trading and Artificial Intelligence
Artificial intelligence is becoming increasingly connected with quantitative finance.
Traditional quantitative models usually follow rules created directly by researchers or traders.
Machine learning models can take a different approach.
They may analyze large datasets to identify relationships that are difficult to detect manually.
Possible applications include:
- Pattern recognition
- Market classification
- Volatility forecasting
- Sentiment analysis
- Risk modeling
- Portfolio optimization
Still, complexity does not guarantee better results.
A complicated machine learning model can overfit historical data just as easily as a simple strategy.
Data quality, risk control, and realistic testing remain essential.
Challenges of Quantitative Trading
Quantitative trading offers useful tools, but it also comes with several challenges.
Markets Change
Financial markets are not static.
A strategy that performed well five years ago may behave differently today.
Historical Data Has Limitations
Historical data can contain errors or incomplete information.
Even high-quality data cannot recreate every condition experienced during real trading.
Trading Costs Matter
Small trading costs can significantly affect strategies that place many trades.
Models Can Break
Every quantitative model is based on assumptions.
If those assumptions stop reflecting market behavior, performance can change quickly.
Technology Adds Risk
Automated trading depends on technology.
Technical failures can affect execution and risk management.
How Beginners Can Explore Quantitative Trading
Beginners do not need to build complex algorithms immediately.
A simpler approach can be more useful.
Start with a basic trading idea.
Then define it clearly.
For example:
- Which market will you trade?
- What creates an entry?
- What creates an exit?
- Where is the stop loss?
- How large is each position?
- When should the strategy avoid trading?
Next, collect historical data and study how the rules behaved.
The objective is not to create the perfect strategy.
Instead, the goal is to develop a structured way of thinking about trading.
Is Quantitative Trading Profitable?
Quantitative trading can be profitable, but it does not guarantee profits.
The term describes a method of developing and executing strategies. It does not describe a guaranteed outcome.
Successful quantitative trading depends on many factors, including:
- Strategy quality
- Data quality
- Execution
- Market conditions
- Trading costs
- Risk management
- Position sizing
- Ongoing research
Strategies can also stop working.
Therefore, traders should avoid assuming that historical performance will automatically continue.
The Future of Quantitative Trading
Quantitative trading will likely continue evolving as traders gain access to more computing power, data, and analytical tools.
Artificial intelligence may also make advanced forms of analysis more accessible.
At the same time, increased access means more market participants can study similar patterns.
As more traders compete for the same opportunities, strategies may need to adapt more quickly.
The future of quantitative trading will therefore involve more than simply finding patterns.
It will require traders to understand data, risk, technology, execution, and changing market conditions.
Final Thoughts on Quantitative Trading
Quantitative trading provides a structured way to analyze financial markets.
Instead of relying entirely on instinct, traders can define specific rules and evaluate how those rules performed across historical data.
The approach can range from a basic indicator-based system to a sophisticated automated model analyzing thousands of variables.
However, the core idea remains the same.
Create measurable rules. Test them carefully. Understand the risks. Monitor performance. Adjust when conditions change.
Quantitative trading does not remove uncertainty from financial markets.
What it can do is provide a more systematic framework for making trading decisions.
For traders interested in data, technology, statistics, automation, and structured decision-making, learning the principles behind quantitative trading can provide a valuable foundation for understanding modern financial markets.
Risk Disclaimer
Trading foreign exchange, CFDs, cryptocurrencies, and other financial instruments involves substantial risk and may not be suitable for every investor. You may lose some or all of your invested capital.
The information provided in this article is for educational and informational purposes only. It does not constitute financial, investment, trading, legal, or tax advice. Nothing in this article should be interpreted as a recommendation to buy, sell, or hold any financial instrument or to use any particular trading strategy.
Examples, strategies, statistics, and references to quantitative trading are provided only to explain general concepts. Past performance, historical testing, simulated performance, and backtesting results do not guarantee future results.
Before trading, carefully consider your financial situation, experience, investment objectives, and risk tolerance. Where appropriate, seek advice from an independent qualified financial professional.
Quantitative Trading: A Complete Guide to Data-Driven Trading Strategies
Quantitative trading has changed the way many traders approach financial markets. Instead of making every decision based on instinct, chart…
CFDs Meaning Trading: A Complete Guide to Understanding Contracts for
One term that frequently appears in online trading is CFDs. If you’ve searched for CFDs meaning trading, you’re likely looking…
FGP1 August 2026 Performance Overview
Geographic Restriction & Risk Notice FGP1 is geographically restricted and is not available to U.S. persons or residents. Trading involves substantial…

Best Robo Advisors: A Complete Guide to Automated Investing
Choosing how to invest has become easier than ever thanks to technology. One of the biggest innovations in recent years…
Best Day Trading App: What Traders Should Look for Before
Day trading has become more accessible than ever. With the rise of mobile technology, cloud-based platforms, and real-time market data,…
FGP1 July 2026 Performance Overview
Geographic Restriction & Risk Notice FGP1 is geographically restricted and is not available to U.S. persons or residents. Trading involves substantial…