
Geographic Restriction & Risk Notice
FGP1 is geographically restricted and is not available to U.S. persons or residents. Trading involves substantial risk, including possible loss of principal. Past performance is not indicative of future results. This material is informational only and does not constitute investment advice, an offer, or a solicitation.
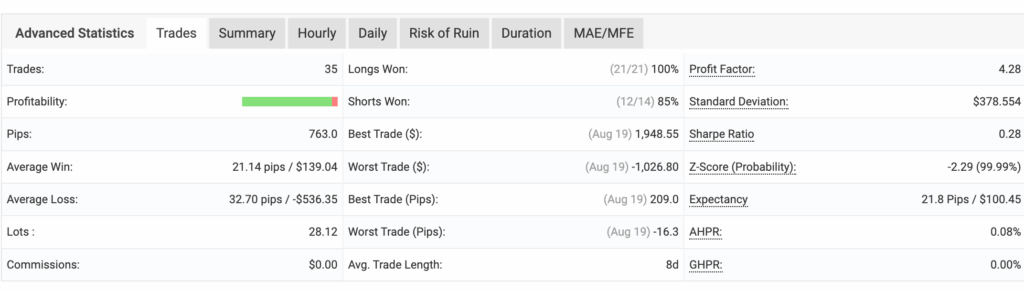
FGP1 delivered a solid performance in August 2026, closing the month with a +2.65% gain. Trading remained selective throughout the month, with the strategy producing 35 total trades, 763.0 pips, a strong profit factor of 4.28, and an overall win rate of approximately 94%.
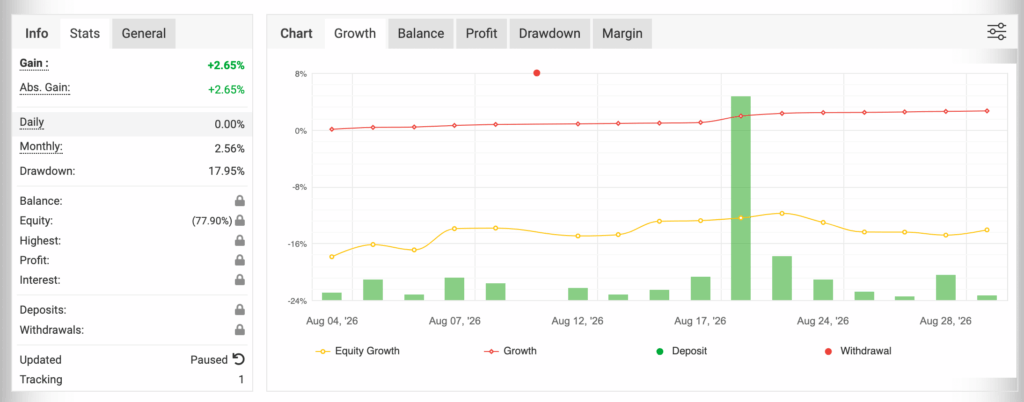
From the account overview, FGP1 posted a +2.65% gain with an absolute gain of +2.65%. The account showed a 17.95% drawdown, while equity stood at 77.90% of balance at the time the screenshot was captured. The growth line remained positive through August, although open equity continued to fluctuate below closed account growth.
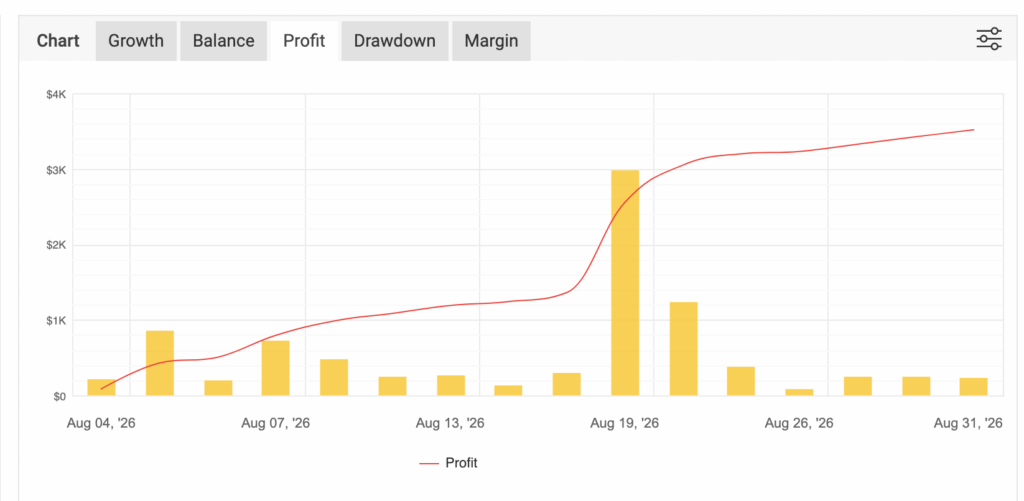
The profit chart shows how performance built over the course of the month. Gains developed gradually during the first half of August before a strong move around August 19 produced the largest visible increase in cumulative profit. Additional gains followed through the remainder of the month, allowing the profit line to finish near its August high.
Trading Statistics
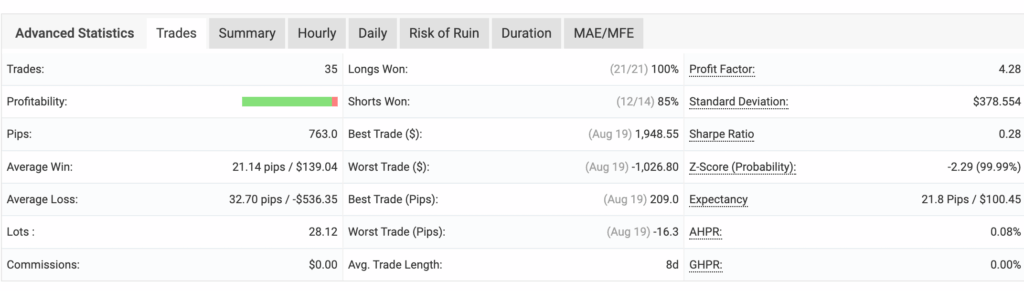
FGP1 completed 35 trades in August and generated 763.0 pips. Long trades performed exceptionally well, with 21 out of 21 longs closed in profit, while short trades recorded 12 wins out of 14. The system’s profit factor of 4.28 reflects a strong overall result for the month.
Additional key statistics from August include:
- Average win: 21.14 pips / $139.04
- Average loss: 32.70 pips / -$536.35
- Best trade: 209.0 pips / $1,948.55
- Worst trade: -16.3 pips / -$1,026.80
- Average trade length: 8 days
- Commissions: $0.00
Hourly Performance
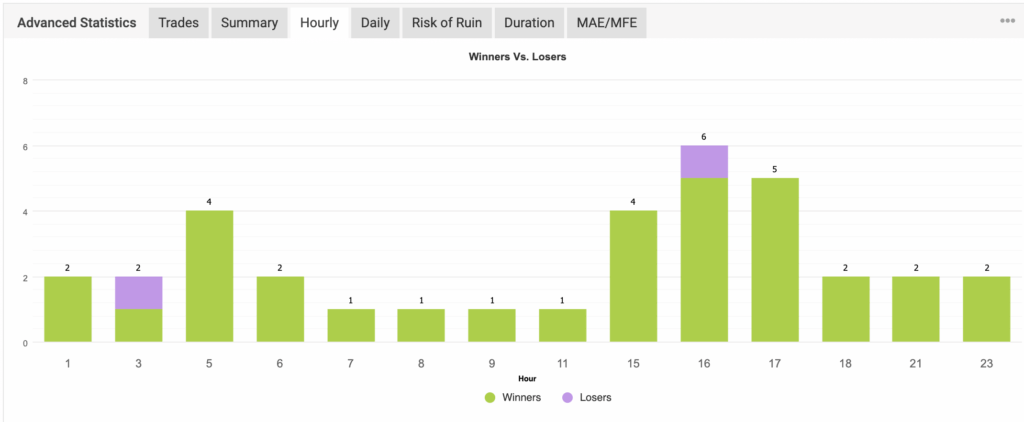
The hourly breakdown shows that FGP1 saw particularly strong activity later in the trading day. The most active trading windows were around 16:00 and 17:00, with 16:00 recording six trades and 17:00 recording five winning trades.
The chart also shows that losses were limited, with one visible losing trade around 03:00 and another around 16:00.
Daily Performance
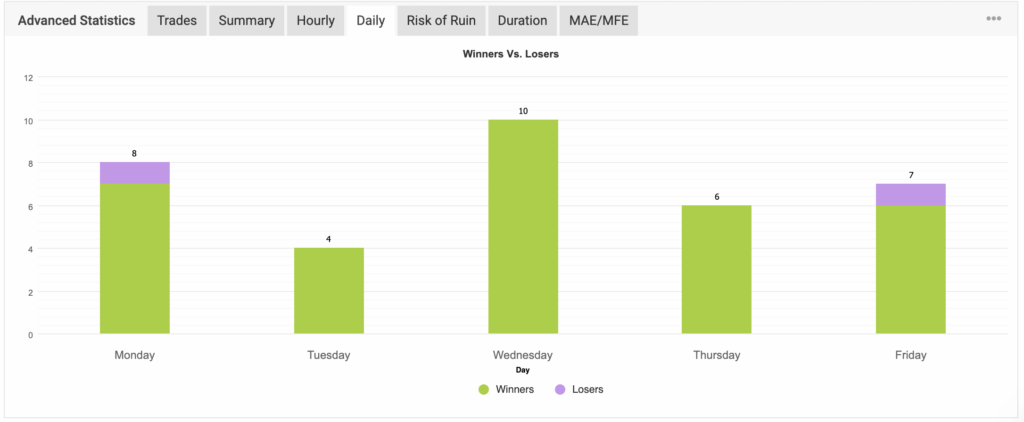
Looking at results by day, Wednesday was the strongest day of the week with 10 winning trades. Monday recorded 8 total trades, including seven winners, while Friday recorded 7 total trades, including six winners.
Tuesday produced 4 winners, while Thursday produced 6 winners. Overall, performance was distributed throughout the trading week rather than relying on one isolated day.
Risk Management

Risk metrics remained stable in August. The Risk of Ruin model showed a probability of loss below 0.01% across every displayed loss-size scenario.
The model estimated that it would require 20 consecutive losing trades to reach a modeled 10% loss, 40 consecutive losses for a 20% loss, and 198 consecutive losses for a modeled 100% loss.
These figures are statistical estimates generated by the platform and should not be interpreted as guarantees of future performance.
Trade Duration Insights
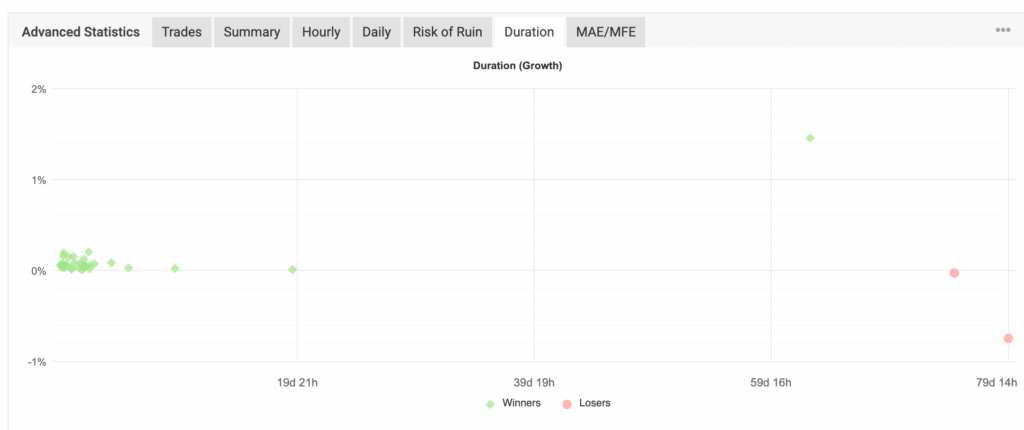
The duration chart shows that most trades were concentrated within shorter holding periods, while a smaller number remained open considerably longer.
The overall average trade length was 8 days. However, several outliers extended beyond 60 days, demonstrating that individual positions can remain open substantially longer than the monthly average.
Monthly Analytics Breakdown
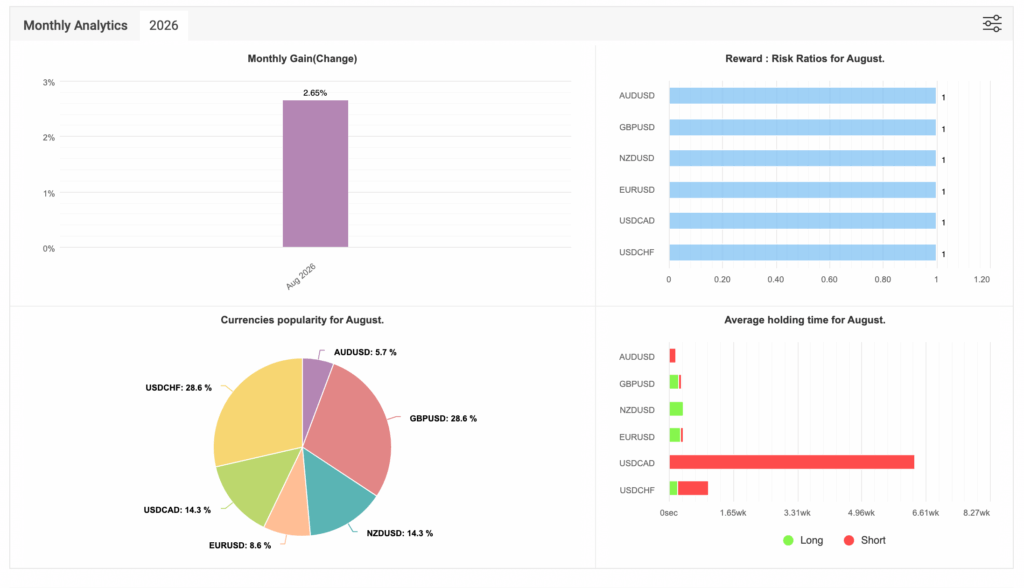
The monthly analytics panel confirms August’s +2.65% gain. In terms of pair distribution, trading activity was led by GBPUSD and USDCHF, which each accounted for 28.6% of total activity.
They were followed by:
- NZDUSD: 14.3%
- USDCAD: 14.3%
- EURUSD: 8.6%
- AUDUSD: 5.7%
Reward-to-risk ratios were displayed at approximately 1:1 across all six currency pairs.
The holding-time data also shows that USDCAD positions were held the longest on average, particularly on the short side, while most other pairs had considerably shorter holding periods.
Final Thoughts
August 2026 was another positive month for FGP1. A +2.65% monthly gain, 763.0 pips, approximately 94% of trades closing as winners, and a 4.28 profit factor made for a strong overall result.
The month also reinforces the importance of looking beyond win rate alone. Open-equity movement, the 17.95% displayed drawdown, individual loss size, and longer-duration positions remain important parts of the overall risk profile.
As always, we remain focused on long-term performance, responsible risk control, and delivering verified results month after month.
FGP1 September 2026 Performance Overview
Geographic Restriction & Risk Notice FGP1 is geographically restricted and is not available to U.S. persons or residents. Trading involves substantial…

Australian Dollar (AUD): Why It Strengthened in 2026 and What
The Australian dollar (AUD) has attracted considerable attention in the foreign exchange market throughout 2026. After experiencing a notable appreciation…

Quantitative Trading: A Complete Guide to Data-Driven Trading Strategies
Quantitative trading has changed the way many traders approach financial markets. Instead of making every decision based on instinct, chart…

CFDs Meaning Trading: A Complete Guide to Understanding Contracts for
One term that frequently appears in online trading is CFDs. If you’ve searched for CFDs meaning trading, you’re likely looking…
FGP1 August 2026 Performance Overview
Geographic Restriction & Risk Notice FGP1 is geographically restricted and is not available to U.S. persons or residents. Trading involves substantial…

Best Robo Advisors: A Complete Guide to Automated Investing
Choosing how to invest has become easier than ever thanks to technology. One of the biggest innovations in recent years…
