Table of Contents
- Introduction
- What Is a Pullback (Retracement)
- Essential Blocks Advanced Heading
- Pullback vs. Reversal: Key Difference
- How to Identify Pullbacks on the Chart
- Trading Strategies Using Pullbacks
- Example: Pullback in a Forex Uptrend
- Take control of your trading future
- Common Mistakes When Trading Pullbacks
- Tools to Help You Trade Pullbacks Effectively
- Risk Management When Trading Pullbacks
- Advanced Concepts: Shallow vs. Deep Pullbacks
- Psychological Aspect of Trading Pullbacks
- Conclusion: Master the Pullback, Master the Trend
Introduction
In Forex trading, prices rarely move in a perfectly straight line. Even in a strong trend, whether upward or downward, there are always pauses, small reversals, and temporary counter-moves. These short-term corrections are known as pullbacks or retracements.
Understanding pullbacks is one of the most important skills a trader can develop. Why? Because these price corrections often present excellent opportunities to enter trades in the direction of the overall trend, rather than chasing price after a big move.
In this article, we’ll explore:
- What pullbacks and retracements are
- Why they happen
- How to identify them on the chart
- The difference between retracements and reversals
- Trading strategies that use pullbacks effectively
- Common mistakes to avoid
By the end, you’ll see why mastering pullback trading can be a game-changer for anyone following market trends.

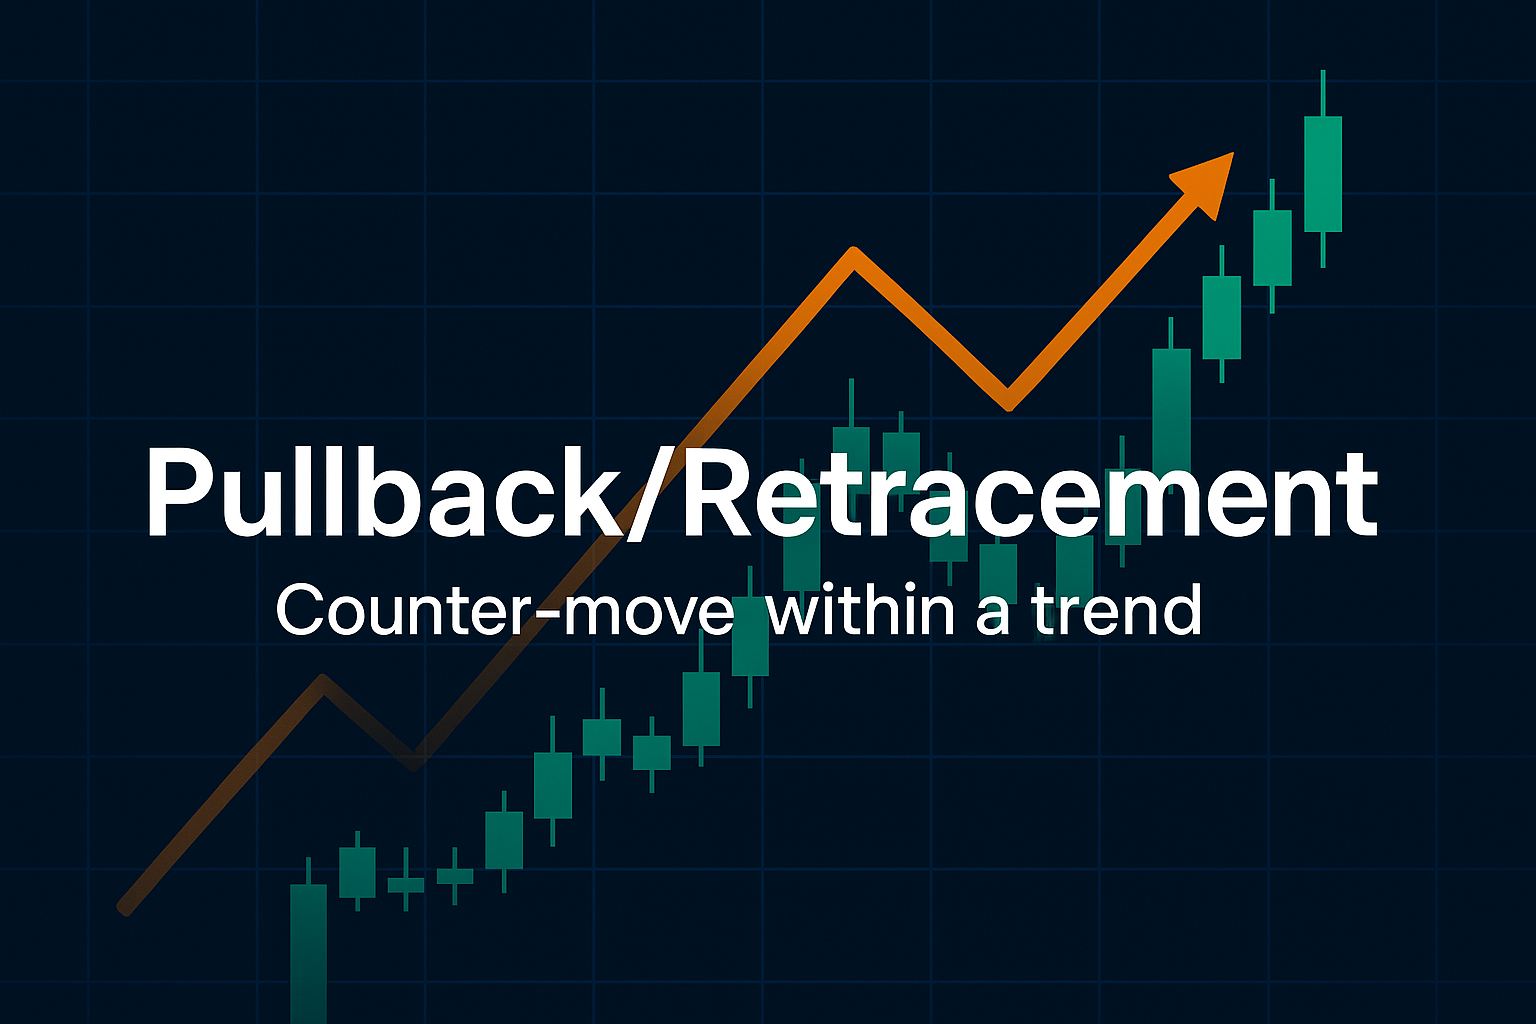
What Is a Pullback (Retracement)
A pullback, also called a retracement, is a temporary counter-move within a trend.
- In an uptrend, price moves upward but then temporarily falls back before continuing higher.
- In a downtrend, price moves downward but then briefly bounces upward before continuing lower.
Think of it as the market “taking a breath” before resuming its main direction.
📌 Example:
If EUR/USD is trending upward and rallies from 1.0800 to 1.1000, then drops back to 1.0950 before climbing again to 1.1100, that dip from 1.1000 to 1.0950 is a pullback.
Pullbacks occur because of market psychology and order flow dynamics.
- Profit-taking: Traders who entered early in the trend close positions, creating temporary pressure in the opposite direction.
- New traders waiting for entries: Instead of chasing price, disciplined traders wait for better entry points. Their buying or selling pressure kicks in during pullbacks.
- Market noise: Short-term volatility, news events, or liquidity shifts can cause temporary price corrections even within a strong trend.
In short: Pullbacks are natural and healthy. They allow trends to continue without becoming overextended.
Pullback vs. Reversal: Key Difference
Many beginners confuse a retracement with a reversal. Knowing the difference can prevent costly mistakes.
- Pullback (Retracement): A temporary counter-move. The main trend remains intact. After the pullback, price resumes in the same direction.
- Reversal: A complete change in direction. The uptrend ends, and a downtrend begins (or vice versa).
How to Spot the Difference:
- Trend structure
- Pullback: Higher highs and higher lows (in an uptrend) remain intact.
- Reversal: The market breaks the pattern and forms lower highs and lower lows (or vice versa).
- Pullback: Higher highs and higher lows (in an uptrend) remain intact.
- Volume and momentum
- Pullback: Lower momentum, smaller candles.
- Reversal: Strong opposite candles, high momentum.
- Pullback: Lower momentum, smaller candles.
- Support/Resistance
- Pullback: Holds above key support (in an uptrend) or below resistance (in a downtrend).
- Reversal: Breaks major support or resistance.
- Pullback: Holds above key support (in an uptrend) or below resistance (in a downtrend).
How to Identify Pullbacks on the Chart
Spotting pullbacks is easier when you use a combination of tools. Here are some of the best methods:
1. Trendlines and Channels
Draw a trendline in the direction of the trend. Pullbacks often move toward the trendline before bouncing.
2. Moving Averages
- A 20-period EMA or 50-period SMA often acts as dynamic support/resistance.
- Pullbacks frequently “kiss” these averages before continuing in the trend.
3. Fibonacci Retracement Levels
One of the most popular tools for identifying retracement zones.
- Common retracement levels: 38.2%, 50%, and 61.8%.
- If price retraces into these zones during a trend, it often signals a potential bounce.
4. Price Action Signals
Look for candlestick patterns that confirm the end of a pullback:
- Pin bars
- Engulfing candles
- Dojis near key levels

Trading Strategies Using Pullbacks
Pullback trading is one of the most powerful trend-following techniques. Here are several strategies:
1. Moving Average Pullback Strategy
- Identify a strong trend (e.g., price above 50 EMA in an uptrend).
- Wait for a pullback to the moving average.
- Enter when price shows bullish rejection (candlestick signal).
- Place stop-loss below the recent low (for buys).
2. Fibonacci Retracement Strategy
- Plot Fibonacci from the last swing high to swing low.
- Look for retracements around 38.2% – 61.8% levels.
- Enter in the direction of the main trend once price confirms rejection.
3. Support/Resistance Pullback Entry
- Wait for price to break above resistance (in an uptrend).
- On the pullback, the old resistance becomes support.
- Enter when price bounces, targeting continuation.
4. Trendline Bounce
- Draw a trendline connecting lows in an uptrend.
- When price pulls back to the trendline, watch for bullish confirmation to enter.
Example: Pullback in a Forex Uptrend
Imagine GBP/USD is trending higher.
- Price rallies from 1.2400 → 1.2600.
- It retraces to 1.2520 (a 38.2% Fibonacci retracement).
- A bullish engulfing candle forms near the 50 EMA.
- The uptrend continues, rallying to 1.2800.
A trader who entered at 1.2520 rode the pullback and profited from the continuation.
Take control of your trading future
Supercharge your trading with our expert advisors. Start your journey today!
Common Mistakes When Trading Pullbacks
Many traders fail with pullbacks because they:
- Mistake reversals for pullbacks
- Solution: Always confirm with structure and indicators.
- Solution: Always confirm with structure and indicators.
- Enter too early
- Solution: Wait for confirmation (candlestick signal, bounce, or indicator alignment).
- Solution: Wait for confirmation (candlestick signal, bounce, or indicator alignment).
- Chase price after the pullback is over
- Solution: Plan entries in advance. Don’t chase.
- Solution: Plan entries in advance. Don’t chase.
- Ignore higher timeframes
- Solution: Always check the bigger picture. A pullback on the 1H chart may be a reversal on the daily chart.
- Solution: Always check the bigger picture. A pullback on the 1H chart may be a reversal on the daily chart.
Tools to Help You Trade Pullbacks Effectively
Manual analysis works, but trading is far more effective when combined with technology. At Auvoria Prime, we believe in empowering traders with AI-driven software tools that help identify high-probability entries automatically.
With expert advisors (EAs) and advanced trading systems, you can:
- Spot pullbacks and retracements faster
- Automate entries and exits
- Reduce emotional mistakes
- Backtest strategies across multiple pairs
This gives traders the edge they need to capitalize on counter-moves without second-guessing themselves.
👉 Learn more about Auvoria Prime’s software solutions: https://auvoriaprime.com
Risk Management When Trading Pullbacks
Even with the best setup, not every pullback will hold. Sometimes, a pullback develops into a full reversal. That’s why risk management is crucial.
Rules to Follow:
- Use Stop-Loss Orders
- Place stops beyond the pullback low/high.
- Place stops beyond the pullback low/high.
- Risk 1-2% of account per trade
- Never overexpose yourself.
- Never overexpose yourself.
- Confirm trend strength
- Use indicators like ADX or check multiple timeframes.
- Use indicators like ADX or check multiple timeframes.
- Don’t double down on losing trades
- Accept small losses, move to the next opportunity.
- Accept small losses, move to the next opportunity.
Advanced Concepts: Shallow vs. Deep Pullbacks
Not all pullbacks are the same.
- Shallow Pullbacks
- Retrace only 23.6% or 38.2% of the previous move.
- Indicate very strong trends.
- Often tricky because they don’t give much room for entry.
- Retrace only 23.6% or 38.2% of the previous move.
- Deep Pullbacks
- Retrace 50% or 61.8%.
- Provide better entry opportunities but carry slightly more risk of reversal.
- Retrace 50% or 61.8%.
Knowing the difference helps traders adjust position sizing and expectations.
Psychological Aspect of Trading Pullbacks
Trading pullbacks requires patience and discipline. Many traders fail because they:
- Chase price instead of waiting for pullbacks
- Fear missing out (FOMO) and enter too early
- Panic during drawdowns
By training yourself to wait for confirmation, pullbacks become one of the most reliable entry points in trading.

Conclusion: Master the Pullback, Master the Trend
Pullbacks and retracements are natural counter-moves within a trend. Far from being random noise, they are opportunities for traders to join the trend at better prices.
By learning how to:
- Identify pullbacks vs reversals
- Use tools like moving averages, Fibonacci, and support/resistance
- Trade with confirmation
- Manage risk properly
…you can greatly improve your consistency as a trader.
At Auvoria Prime, we encourage traders to combine knowledge with technology. With our expert advisors and software, identifying pullbacks becomes more systematic, giving you confidence to trade trends with precision.
📌 Ready to take your trading to the next level?
Explore our tools today at https://auvoriaprime.com

FGP1 June 2026 Performance Overview
Geographic Restriction & Risk Notice FGP1 is geographically restricted and is not available to U.S. persons or residents. Trading involves substantial…

Best Day Trading App: What Traders Should Look for Before
Day trading has become more accessible than ever. With the rise of mobile technology, cloud-based platforms, and real-time market data,…
Top Stock Brokers: How to Choose the Right Platform for
Choosing from the top stock brokers can feel overwhelming. There are many platforms, account types, tools, fees, apps, and trading…

Currency Strength Meter: How Traders Use Currency Strength to Read
What Is a Currency Strength Meter? A currency strength meter is a trading tool that helps traders compare the relative strength…

Commodity Prices Today: How Traders Can Read Market Movement With
Introduction Commodity prices today can move quickly. Oil, gold, silver, copper, wheat, corn, natural gas, and other raw materials can all…

Autopilot App: A Simple Guide to Smarter Trading Automation
IntroductionWhat Is an Autopilot App?Why Traders Are Interested in Autopilot AppsHow an Autopilot App WorksAutopilot App vs Manual TradingMain Benefits…