Relative Strength Index: A Key Tool in Forex Trading
The Relative Strength Index (RSI) is a crucial tool in the arsenal of many forex traders, helping them navigate the volatile waters of currency markets. Developed by J. Welles Wilder in 1978, Relative Strength Index is a momentum oscillator that measures the speed and change of price movements. It is a versatile indicator that can signal potential entry and exit points, trend strength, and even help traders avoid pitfalls like false breakouts.
Understanding RSI
RSI is a bounded oscillator that fluctuates between 0 and 100. It is typically calculated over a 14-period timeframe, though traders can adjust this to suit their trading strategy. The RSI formula is:

Where RS (Relative Strength) is the average of ‘n’ days’ up closes divided by the average of ‘n’ days’ down closes.
Key Levels: Overbought and Oversold
One of the primary uses of Relative Strength Index is identifying overbought and oversold conditions in the market. Traditionally, an RSI above 70 indicates that a currency pair may be overbought, suggesting that it might be due for a price correction or a reversal. Conversely, an RSI below 30 indicates that a currency pair may be oversold, which could signal a buying opportunity as the price might be poised to rise.
Divergences: A Powerful Signal
Divergences between RSI and price action can be powerful indicators of potential market reversals. A bullish divergence occurs when the price makes a lower low, but the RSI forms a higher low. This suggests that the selling pressure is weakening, and a reversal to the upside may be imminent. On the other hand, a bearish divergence happens when the price makes a higher high, but the RSI records a lower high, signaling that the buying momentum is fading and a downward reversal could be on the horizon.
RSI and Trend Analysis
In addition to spotting overbought and oversold conditions, RSI is also useful in trend analysis. When Relative Strength Index is consistently above 50, it generally indicates an uptrend, while a reading below 50 suggests a downtrend. Traders often use the 50 level as a reference point to confirm the strength of a trend or to identify potential trend reversals.

Combining RSI with Other Indicators
While RSI is a powerful tool on its own, combining it with other technical indicators can enhance its effectiveness. For instance, traders often use RSI in conjunction with Moving Averages (MAs), Bollinger Bands, or MACD (Moving Average Convergence Divergence) to confirm signals and filter out false positives. For example, a trader might look for an RSI divergence at a critical Moving Average support or resistance level to increase the probability of a successful trade.
Common Pitfalls and Misinterpretations
Despite its usefulness, RSI is not without its limitations. One common pitfall is relying solely on RSI to make trading decisions. Market conditions can sometimes lead to prolonged periods of high or low RSI readings without any significant price reversals. This is particularly true in strong trending markets where the RSI can stay in overbought or oversold territory for extended periods.
Another mistake is ignoring the broader market context. RSI should be used as part of a comprehensive trading strategy that considers other factors, such as fundamental analysis, market sentiment, and risk management.
Unlock the full potential of forex
Get your expert advisor now and trade with precision!
Conclusion
The Relative Strength Index (RSI) remains one of the most popular and widely used technical indicators in forex trading. Its ability to measure momentum, identify overbought and oversold conditions, and signal potential trend reversals makes it a valuable tool for traders. However, like any tool, its effectiveness depends on how well it is used in conjunction with other indicators and within the context of a broader trading strategy. By understanding the nuances of RSI and avoiding common pitfalls, traders can enhance their ability to make informed decisions in the fast-paced world of forex trading.
FGP1 June 2026 Performance Overview
Geographic Restriction & Risk Notice FGP1 is geographically restricted and is not available to U.S. persons or residents. Trading involves substantial…

Best Day Trading App: What Traders Should Look for Before
Day trading has become more accessible than ever. With the rise of mobile technology, cloud-based platforms, and real-time market data,…


Top Stock Brokers: How to Choose the Right Platform for
Choosing from the top stock brokers can feel overwhelming. There are many platforms, account types, tools, fees, apps, and trading…
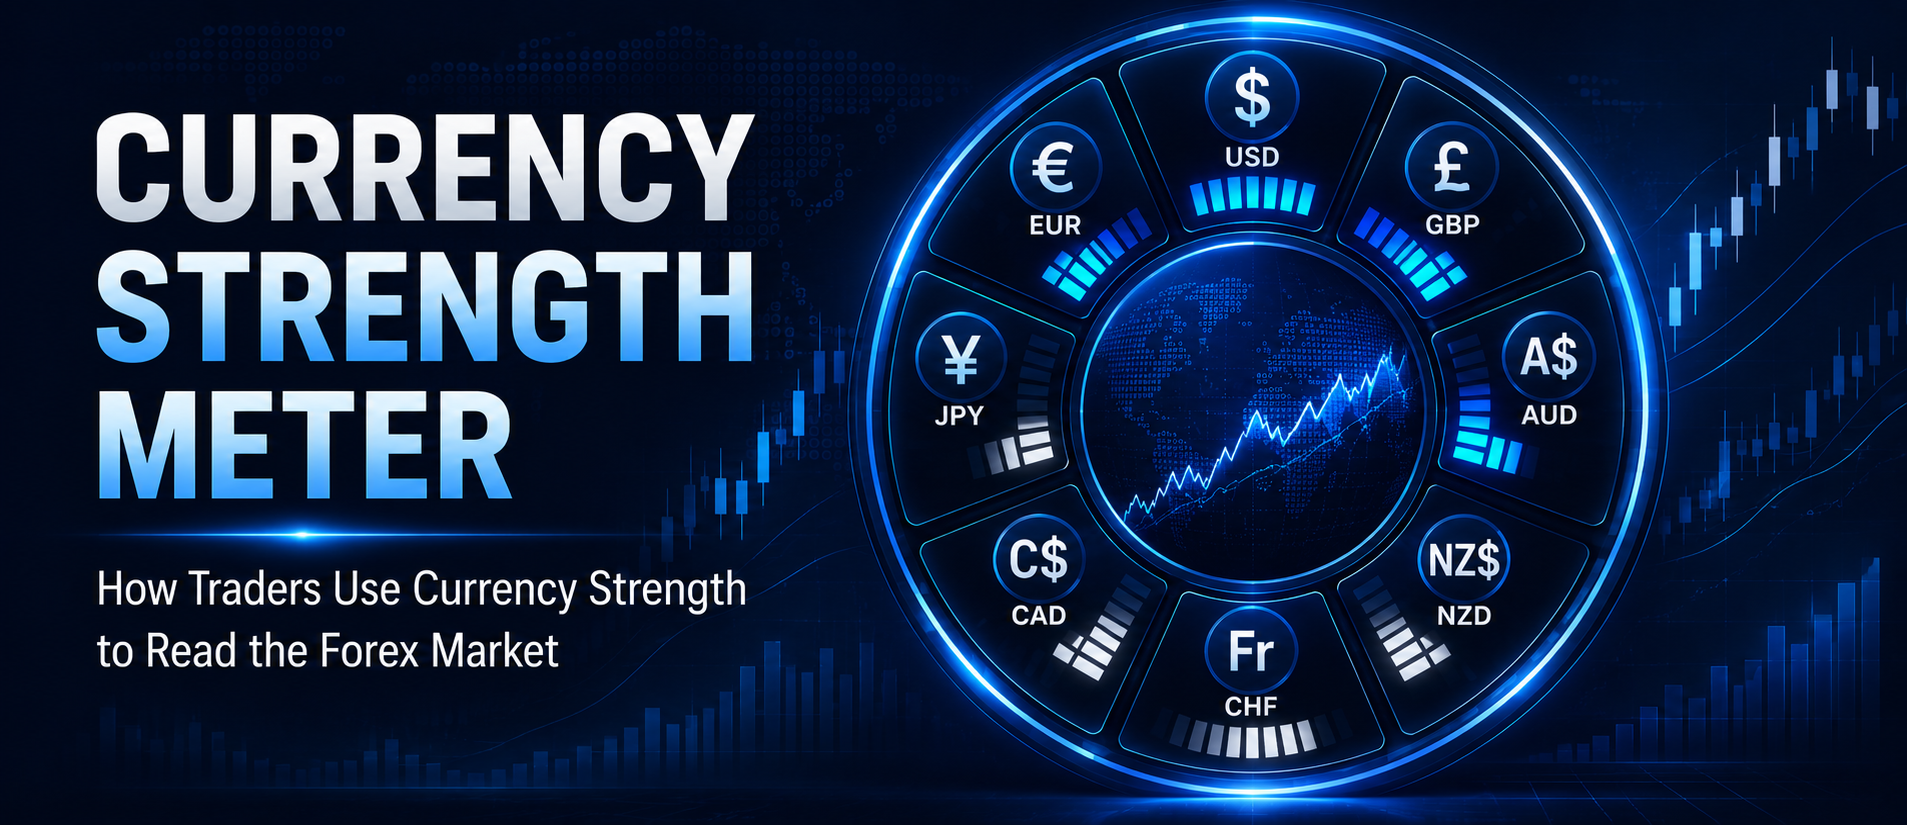
Currency Strength Meter: How Traders Use Currency Strength to Read
What Is a Currency Strength Meter? A currency strength meter is a trading tool that helps traders compare the relative strength…


Commodity Prices Today: How Traders Can Read Market Movement With
Introduction Commodity prices today can move quickly. Oil, gold, silver, copper, wheat, corn, natural gas, and other raw materials can all…

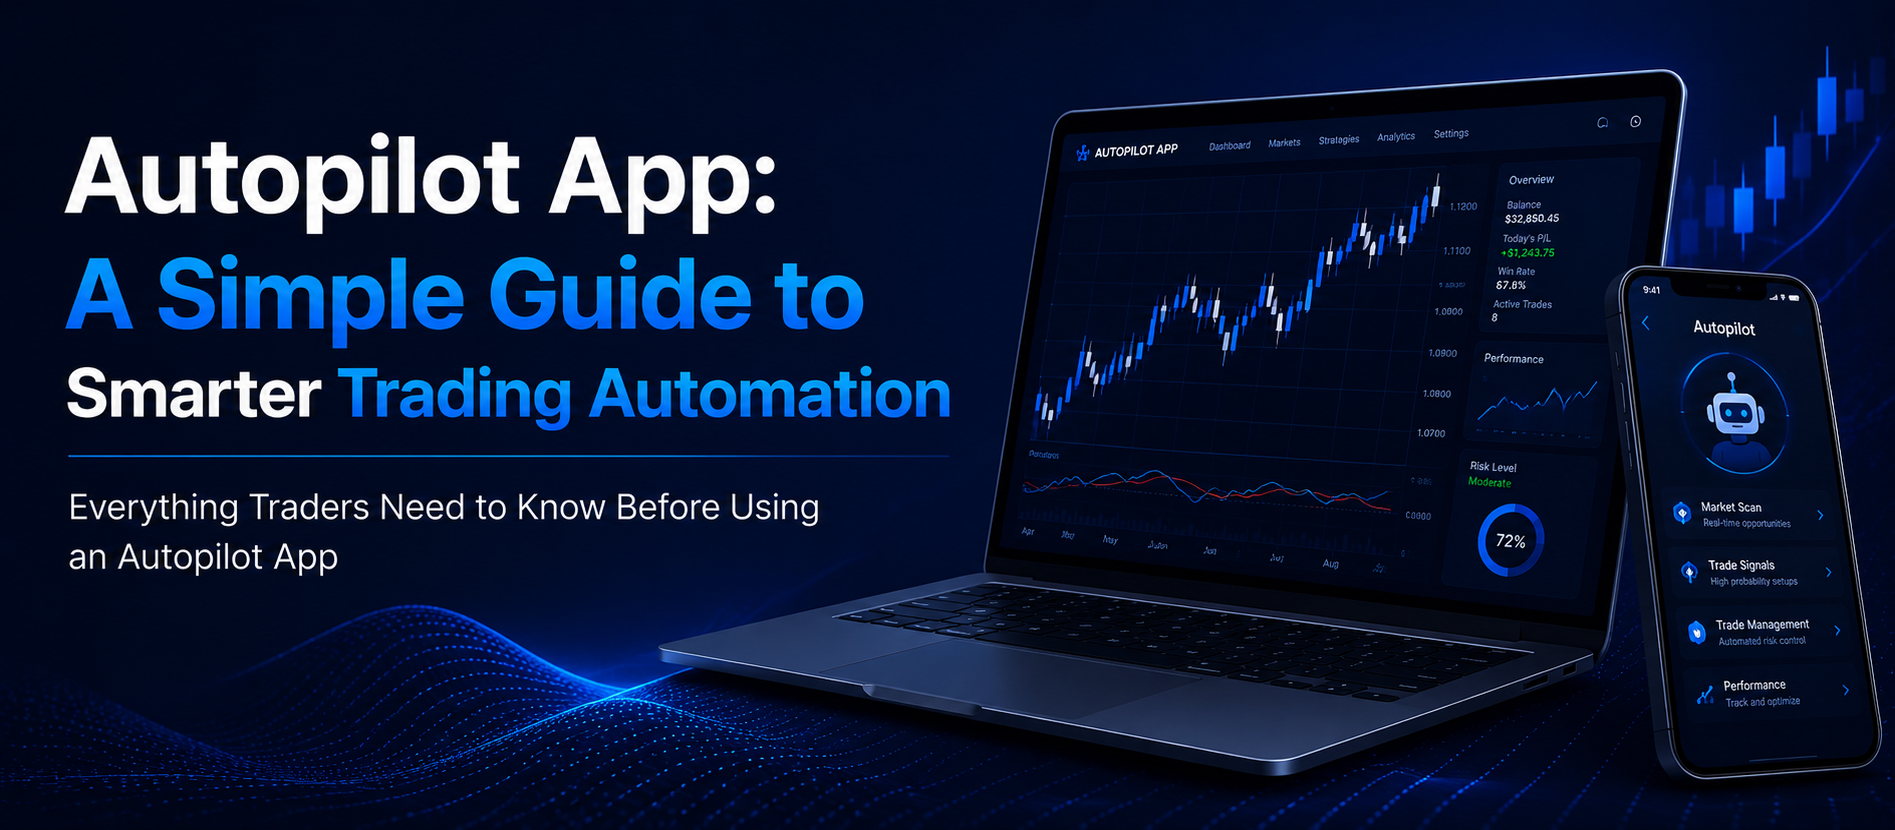
Autopilot App: A Simple Guide to Smarter Trading Automation
IntroductionWhat Is an Autopilot App?Why Traders Are Interested in Autopilot AppsHow an Autopilot App WorksAutopilot App vs Manual TradingMain Benefits…