
Geographic Restriction & Risk Notice
FGP1 is geographically restricted and is not available to U.S. persons or residents. Trading involves substantial risk, including possible loss of principal. Past performance is not indicative of future results. This material is informational only and does not constitute investment advice, an offer, or a solicitation.

Why we publish monthly reports (and why “risk-first” matters)
Most trading performance content online is built to impress, not to inform. That usually means highlighting a single return number, minimizing the uncomfortable statistics, and using language that implies repeatability (“consistent,” “steady,” “safe,” etc.). That isn’t how professional risk management works.
Our goal with FGP1 monthly reporting is different: transparency, context, and disciplined communication.
A single month’s return—good or bad—doesn’t tell you much on its own. It becomes useful only when paired with the rest of the picture:
- What level of drawdown was observed in the same reporting window?
- How many trades produced the outcome (and were they concentrated or distributed)?
- What do the statistics say about variability, expectancy, and dispersion?
- How was activity distributed across the traded instruments?
January 2026 is reported with that exact framework.
January 2026 Snapshot (FGP1)
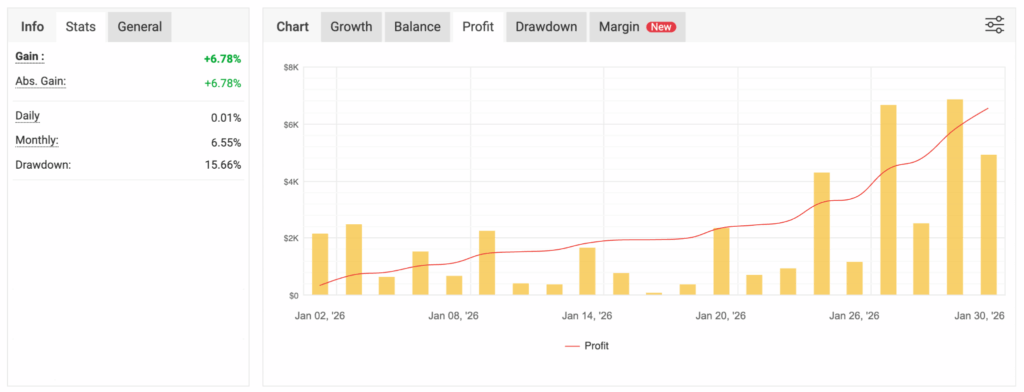
January closed as a strong month for FGP1 based on the Myfxbook reporting views provided. Performance appears in slightly different fields depending on the dashboard view:
- Monthly: 6.55%
- Gain / Absolute Gain: +6.78%
- Monthly Gain (Change) chart: 6.78%
For plain-language reporting, we summarize January as ~+6.6%, while keeping the specific values above intact.
Drawdown shown: 15.66% (as displayed on the Myfxbook panel).
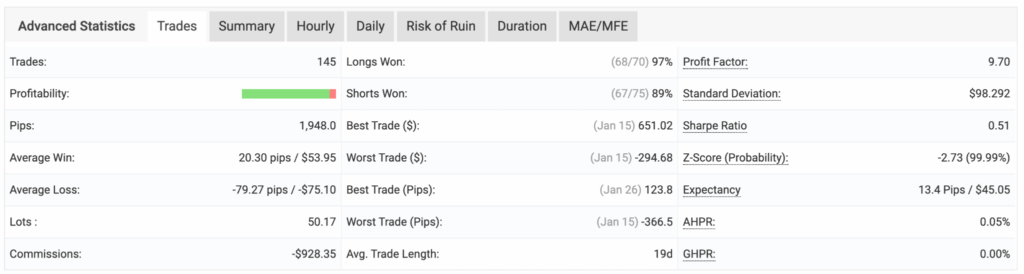
Key month metrics from the screenshots:
- Trades: 145
- Pips: 1,948.0
- Profit Factor: 9.70
- Sharpe Ratio: 0.51
- Expectancy: 13.4 pips / $45.05
- Standard Deviation: $98.292
- Best trade: $651.02 (Jan 15)
- Worst trade: -$294.68 (Jan 15)
- Best trade (pips): 123.8 (Jan 26)
- Worst trade (pips): -366.5 (Jan 15)
- Avg. trade length: 19 days
- Commissions: -$928.35
- Directional win rates: Longs 97% (68/70) • Shorts 89% (67/75)
What matters most: risk management framing
Auvoria Prime’s FGP1 reporting is written with a risk-first lens, because a monthly gain number doesn’t mean much unless it’s contextualized properly.
- Single months don’t predict the future. Even strong months should never be projected forward.
- Drawdown is a key part of the return profile. The drawdown figure shown (15.66%) is an important reference point for what the strategy experienced during this reporting view.
- Process beats outcomes. The goal is consistent, transparent reporting: trade distribution, symbol mix, and statistics that help readers judge the month’s characteristics without hype.
Where January’s performance came from
FGP1 traded a seven-pair FX basket in January:
EURUSD, GBPUSD, USDCAD, NZDUSD, EURAUD, AUDUSD, USDCHF
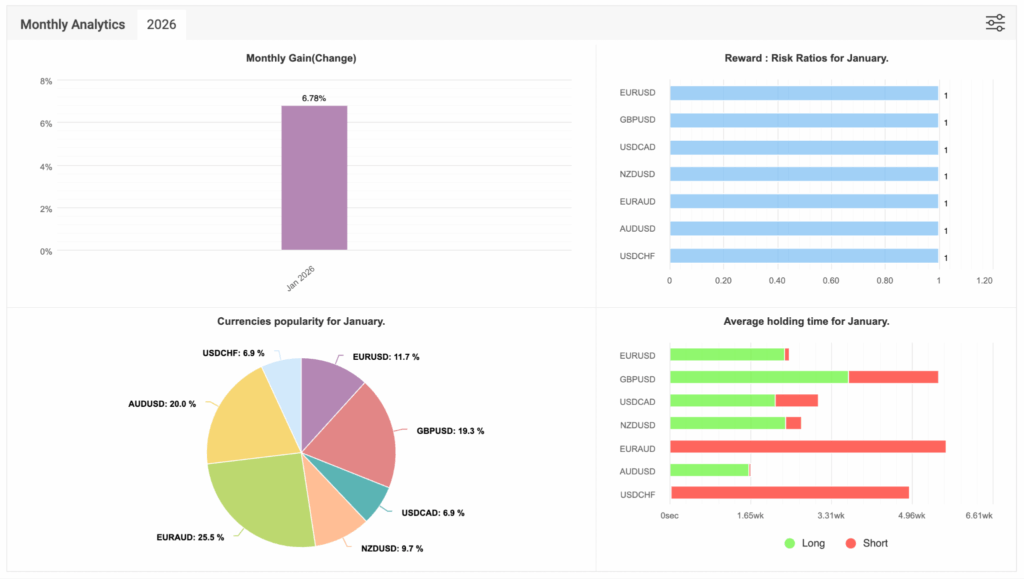
The Monthly Analytics “Currencies popularity” chart showed activity distribution for January as:
- EURAUD: 25.5%
- AUDUSD: 20.0%
- GBPUSD: 19.3%
- EURUSD: 11.7%
- NZDUSD: 9.7%
- USDCHF: 6.9%
- USDCAD: 6.9%
This distribution matters because it provides context on concentration. A month can look great while being dominated by one instrument. January’s activity was spread across multiple pairs, with heavier participation in EURAUD, AUDUSD, and GBPUSD.
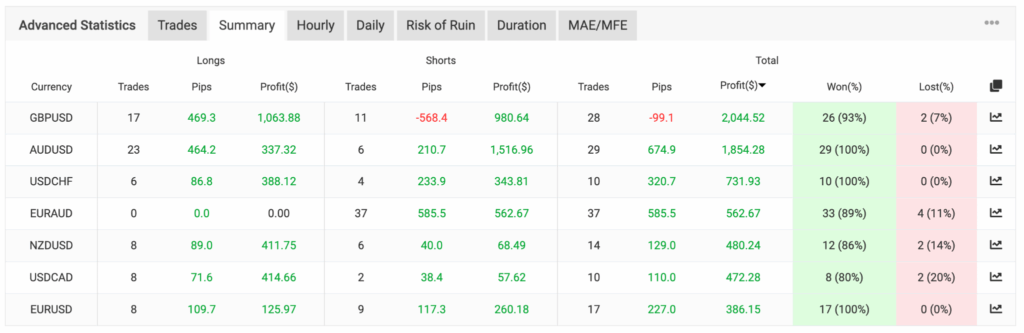
From the per-symbol trade table provided, the largest profit contributors (in account currency) were:
- GBPUSD: $2,044.52
- AUDUSD: $1,854.28
- USDCHF: $731.93
- EURAUD: $562.67
- NZDUSD: $480.24
- USDCAD: $472.28
- EURUSD: $386.15
A notable detail in the same dashboard view: the “Reward : Risk Ratios for January” panel displayed ratio markers at 1 for each of the traded pairs shown. This type of visualization can be useful as a high-level reference, but it should be treated as an informational dashboard view—not a guarantee or forward-looking statement.
Directional behavior: long vs short
The advanced statistics summary showed:
- Longs won: 97% (68/70)
- Shorts won: 89% (67/75)
Directional win rates can help describe the month’s shape, but they should always be interpreted alongside loss magnitude and drawdown. A high win rate does not automatically mean low risk—losses can be infrequent but larger when they occur. That’s why we include both the best/worst trade values and the drawdown figure in every monthly overview.
Time and duration characteristics
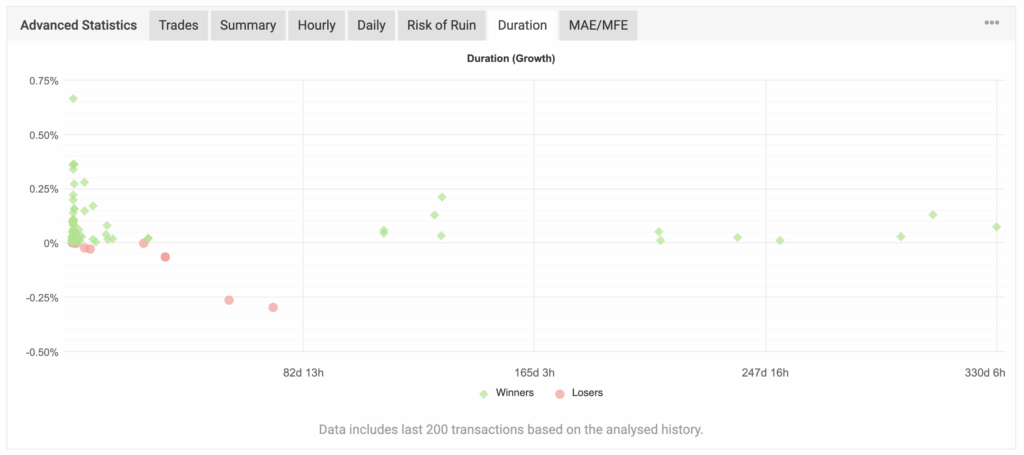
The advanced statistics view reported an average trade length of ~19 days, which is a meaningful exposure characteristic. Duration is time-in-market, and time-in-market is exposure to volatility regimes, correlation changes, and macro-driven swings.
The Monthly Analytics “Average holding time” visualization also suggests holding time varied by pair, with some instruments showing meaningfully longer average holding duration than others. We use this as a practical reminder that monthly results are not just “a number”—they are a product of trade behavior, exposure time, and market conditions.
Hourly behavior (winners vs losers)
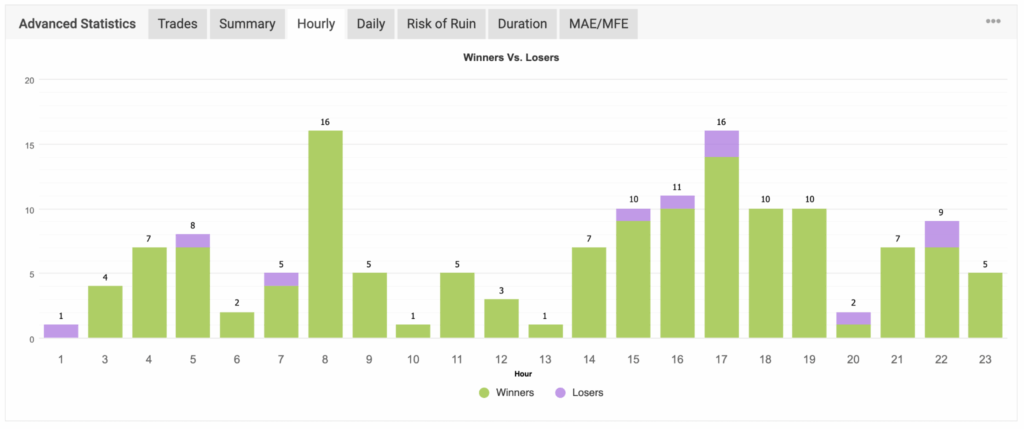
The Hourly winners vs losers chart provided can be useful diagnostically—especially to check whether performance is overly concentrated in a narrow session window or whether losses cluster in particular hours.
January’s hourly distribution shows winners dominating across many hours, with pockets of heavier activity in specific hour blocks. As always, this is a “what happened” view, not a predictive tool, and the purpose is transparency rather than forecasting.
(Daily distribution was not included in this month’s screenshot set, so this report does not make claims about day-of-week behavior.)
Risk-of-ruin: helpful reference, never a guarantee
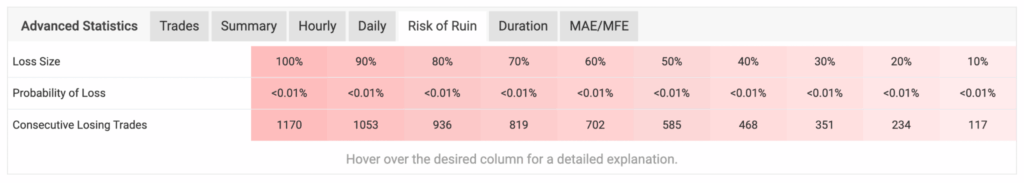
The Risk of Ruin panel displayed a Probability of Loss <0.01% across multiple loss-size thresholds in the view shown.
This type of metric can be helpful as a model-based reference derived from historical behavior and assumptions. It is not a guarantee that losses or drawdowns cannot occur. Markets change, volatility regimes shift, and model assumptions can break—so it should always be read in the context of real-world uncertainty and disciplined risk framing.
Drawdown: why the 15.66% figure matters
January’s Myfxbook panel displayed Drawdown: 15.66%.
Drawdown is often misunderstood. It isn’t simply “how much was lost.” It’s a measure of peak-to-trough decline observed in account behavior during the reporting view (depending on how the platform calculates it and the time window displayed). It matters because it represents the practical discomfort level the strategy can impose, even during profitable periods.
This is why we always pair performance with drawdown context. Risk-first reporting means acknowledging the full experience—not just the headline return.
Comparing trading results to traditional investment tools (responsibly)
Many people try to compare monthly trading performance directly to savings accounts, CDs, bonds, or index funds. The responsible way to do that is to compare risk profiles—not just returns:
- Savings/CDs: typically lower volatility and lower drawdown potential, but returns are constrained by prevailing interest rates and product terms.
- Bonds: can behave differently depending on inflation, rates, duration exposure, and credit conditions—drawdowns can occur in certain environments.
- Equity indexes: historically growth-oriented but can experience substantial drawdowns during recessions and risk-off periods.
- Active FX trading strategies: can generate returns in varied market conditions but carry meaningful risks, including drawdowns and periods of underperformance.
The key point: FGP1 is not a substitute for traditional products. It is a different exposure profile. It should only be evaluated with an understanding of drawdown tolerance, the reality of market regime change, and the fact that outcomes vary.
Closing note
January’s ~+6.6% result is a strong month on the Myfxbook reporting views provided, but the purpose of this monthly overview is not to imply continuation. It’s to publish a consistent reporting record—return, drawdown context, instrument mix, and statistics—so results can be evaluated responsibly over time.
Compliance & Geographic Restriction (End):
This content is for informational purposes only and does not constitute investment advice, an offer, or solicitation. Trading involves substantial risk and may result in loss of capital. Past performance is not indicative of future results; no guarantees are made. Participation is geographically restricted and not available to U.S. persons/residents or in jurisdictions where such activity is prohibited by law.

London Session Forex Time: Everything Traders Need to Know About
The foreign exchange market operates 24 hours a day, five days a week. While trading is possible around the clock,…

FGP1 June 2026 Performance Overview
Geographic Restriction & Risk Notice FGP1 is geographically restricted and is not available to U.S. persons or residents. Trading involves substantial…

Best Day Trading App: What Traders Should Look for Before
Day trading has become more accessible than ever. With the rise of mobile technology, cloud-based platforms, and real-time market data,…

Top Stock Brokers: How to Choose the Right Platform for
Choosing from the top stock brokers can feel overwhelming. There are many platforms, account types, tools, fees, apps, and trading…

Currency Strength Meter: How Traders Use Currency Strength to Read
What Is a Currency Strength Meter? A currency strength meter is a trading tool that helps traders compare the relative strength…

Commodity Prices Today: How Traders Can Read Market Movement With
Introduction Commodity prices today can move quickly. Oil, gold, silver, copper, wheat, corn, natural gas, and other raw materials can all…
