Geographic Restriction & Risk Notice
FGP1 is geographically restricted and is not available to U.S. persons or residents. Trading involves substantial risk, including possible loss of principal. Past performance is not indicative of future results. This material is informational only and does not constitute investment advice, an offer, or a solicitation.
April 2026 was a strong and constructive month for FGP1 based on the Myfxbook results reviewed in this report.
The purpose of this article is to make the numbers easier to understand for every type of reader. If you are an experienced trader, you will appreciate the account statistics, drawdown context, pair distribution, trade duration, and risk data. If you are new to forex or automated trading, this article will help explain what the screenshots mean in plain language.
The most important thing to understand is this:
FGP1 is not just about one monthly result. It is about looking at the complete trading picture.
That means reviewing the monthly return, broader account growth, drawdown, pairs traded, how long trades were held, and how the account behaved during the month.
A positive month is encouraging, but responsible trading analysis always looks deeper than the headline number.
APRIL 2026 AT A GLANCE
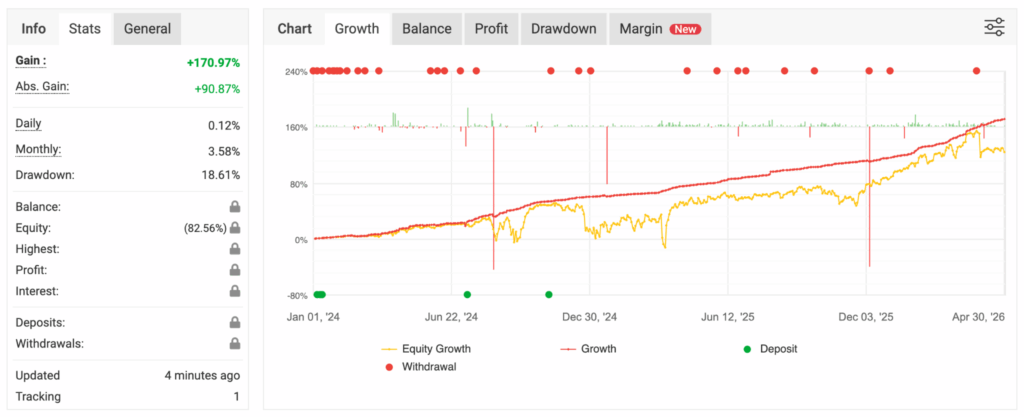
The April 2026 Myfxbook Monthly Analytics dashboard showed a 5% change.
That is the month-specific result being reviewed in this article.
The broader account view also showed important account statistics at the time of the screenshot, including:
- Gain: +170.97%
- Absolute Gain: +90.87%
- Daily: 0.12%
- Drawdown: 18.61%
For someone new to trading, here is the simple way to understand these numbers.
The April result shows how the account performed during that specific month. The gain and absolute gain numbers show the broader account performance over time. The drawdown figure shows the extent of the account’s decline from a previous high.
That drawdown number matters.
Many people only want to focus on profit, but drawdown is one of the most important factors when evaluating any trading strategy. It helps show how much pressure the account has experienced while pursuing the return.
In April, the monthly result was positive. At the same time, the account still carries real trading risk, which is why the drawdown and trading behavior must be reviewed alongside the return.
Why Myfxbook Reporting Matters
One of the advantages of reviewing Myfxbook screenshots is that they allow readers to look beyond simple marketing claims.
Instead of only saying, “The account made money,” we can review the details behind the account behavior.
A serious review should ask questions like:
- What was the monthly performance?
- What was the drawdown?
- Which currency pairs were traded?
- How long were trades held?
- Were results spread across multiple pairs or concentrated in one area?
- Did the account experience large floating movement?
- What does the broader equity curve look like?
This kind of reporting is helpful for both beginners and experienced traders.
For newer readers, it makes the trading activity easier to understand. For experienced traders, it provides more useful data to evaluate the account’s behavior.
FGP1’s April 2026 report is not only about celebrating a positive month. It is about reviewing the month with clarity, transparency, and discipline.
EQUITY PROGRESSION AND BROADER ACCOUNT CONTEXT
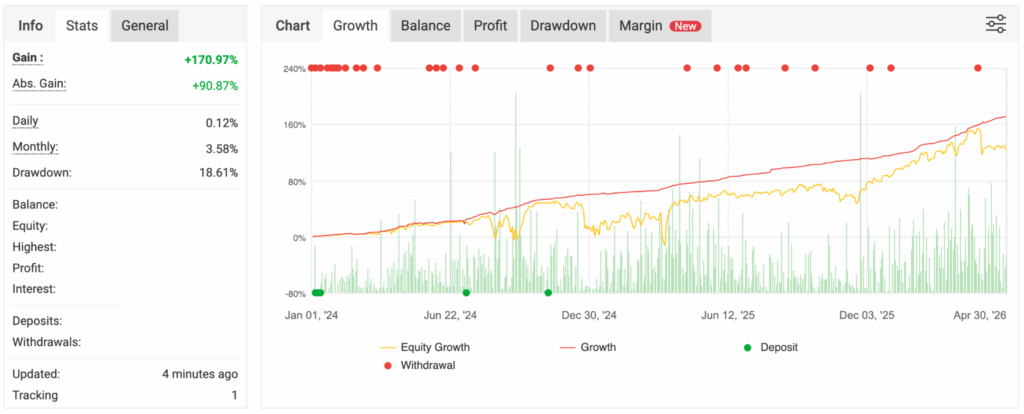
The growth and equity chart gives a visual picture of how the account has progressed over time.
The broader account growth curve continued to show long-term progress into the end of April 2026. That is encouraging because it shows the account has produced meaningful historical growth.
However, the equity line also shows movement and fluctuation.
That is normal in active trading.
A real trading account does not usually move in a perfectly straight line. There are periods of growth, periods of pullback, periods where trades remain open, and periods where the account experiences floating movement before trades close.
This is very important for newer readers to understand.
A strategy can be profitable and still experience a drawdown. A positive account history does not mean every trade wins. A strong month does not mean every day is positive. Automated trading still operates inside live market conditions.
The growth and equity chart helps show the account’s progress, but it also reminds us that this is still forex trading. There is opportunity, but there is also risk.
ADVANCED STATISTICS SNAPSHOT

The Advanced Statistics section gives a deeper look at the account’s overall performance profile.
This section is especially useful for experienced traders because it includes more detailed data, such as win rate, profit factor, average win, average loss, best trade, worst trade, commissions, and overall trade distribution.
For newer readers, the simplest way to think about this section is this:
It helps determine whether the account has been producing results consistently and in a structured way.
A high win rate can be encouraging, but it does not tell the whole story by itself. You also want to understand how large the winning trades are compared to the losing trades.
For example, a strategy could win often, but if the losing trades are much larger than the winning trades, the account may still carry significant risk.
That is why the relationship between average wins, average losses, profit factor, and drawdown matters.
The Advanced Statistics screenshot helps give a more complete picture. It allows the reader to view the account as a system, not just a single monthly result.
The Advanced Statistics Summary tab adds another layer to this FGP1 April 2026 performance overview. While this section reflects the broader history analyzed rather than April alone, it still provides valuable insight into the current profile shown in the account.
These numbers give useful context. First, the win rate remained high in the uploaded snapshot. Second, the Profit Factor remained positive. However, the average loss was still materially larger than the average win. That point matters because it reminds readers that a strong win rate does not remove risk. Instead, the result depends on the total structure of the system, including trade frequency, expectancy, and how losses are managed relative to winners.
In addition, the Summary tab showed commissions, standard deviation, best and worst trades, and broader distribution statistics. Together, these support a picture of a system that has produced a strong longer-term gain profile, but still needs to be read with discipline.
PAIR-LEVEL CONTRIBUTION IN THE BROADER ACCOUNT VIEW
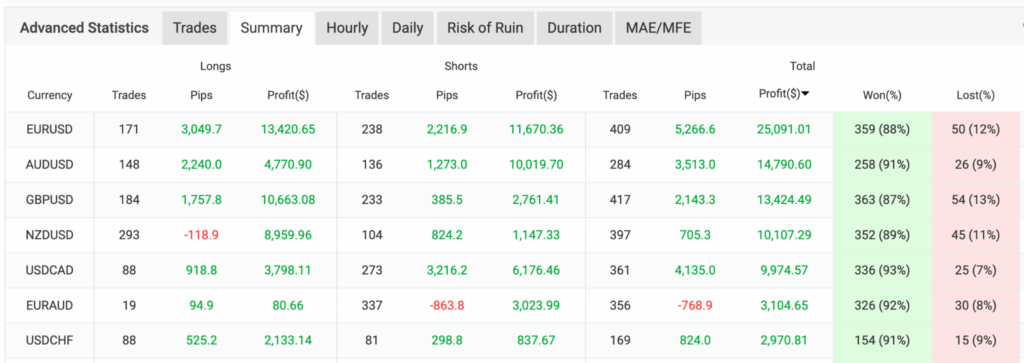
The Trades tab gives a pair-by-pair view of account activity.
This is useful because it shows that the account was not built around only one currency pair.
The visible activity was spread across multiple forex pairs, including major pairs and cross-pair exposure.
For someone newer to trading, this matters because different currency pairs behave differently.
Some pairs trend more smoothly. Some move sharply during news events. Some remain in ranges for longer periods. Some react more strongly to changes in interest rate expectations, economic data, or central bank announcements.
When trading activity is spread across multiple pairs, the account is not relying only on one market for all of its opportunity.
That does not remove risk. Diversification inside a trading strategy does not guarantee safety. However, it does help explain why reviewing pair distribution is important.
For experienced traders, the pair-level view provides another layer of useful analysis. It helps show which instruments contributed more activity and where the account had stronger or weaker behavior.
APRIL 2026 ASSET MIX AND MONTHLY ANALYTICS

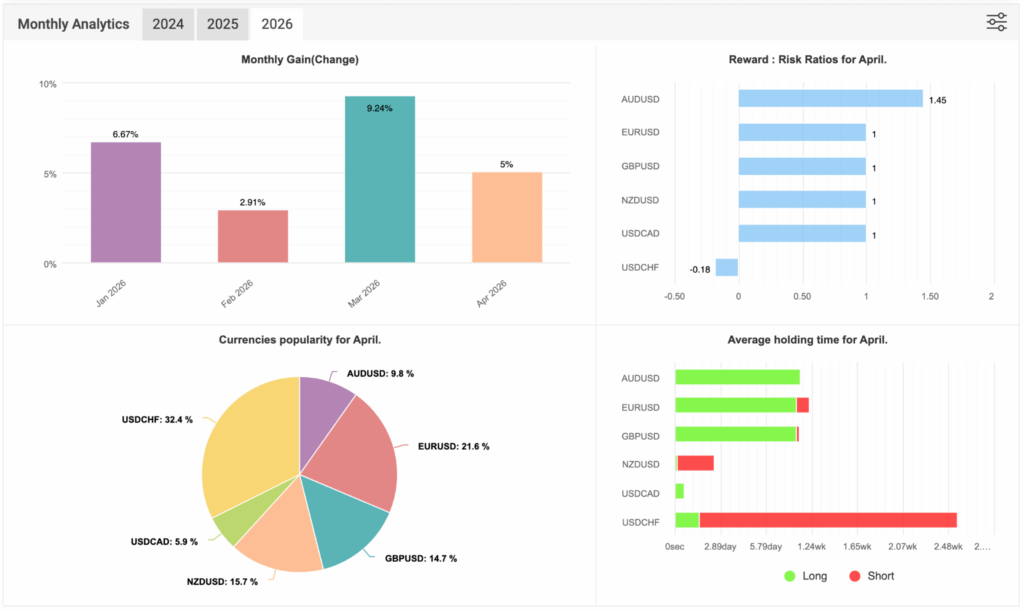
The Monthly Analytics dashboard is one of the most important screenshots because it focuses specifically on April 2026.
For April, the dashboard showed:
- Monthly gain change: 5%
- Reward-to-risk ratio for AUDUSD: 1.45
- Reward-to-risk ratio for EURUSD: 1
- Reward-to-risk ratio for GBPUSD: 1
- Reward-to-risk ratio for NZDUSD: 1
- Reward-to-risk ratio for USDCAD: 1
- Reward-to-risk ratio for USDCHF: -0.18
The April asset popularity mix showed:
- USDCHF: 32.4%
- EURUSD: 21.6%
- NZDUSD: 15.7%
- GBPUSD: 14.7%
- AUDUSD: 9.8%
- USDCAD: 5.9%
This section helps answer a very practical question:
Where did the trading activity happen during the month?
In April, USDCHF represented the largest share of the displayed asset mix, followed by EURUSD. That means a meaningful portion of the month’s activity came from those two pairs.
AUDUSD showed the strongest positive reward-to-risk reading in the April analytics panel. USDCHF, even though it had the largest share of activity, showed a negative reward-to-risk reading in the April view.
That is an important detail.
It shows why it is not enough to know which pair was traded the most. A pair can represent a large share of activity without being the strongest reward-to-risk contributor for that month.
For newer readers, this is one of the reasons we review the screenshots carefully. The goal is not just to show that April was positive. The goal is to understand how the month was built.
AVERAGE HOLDING TIME AND TRADE BEHAVIOR
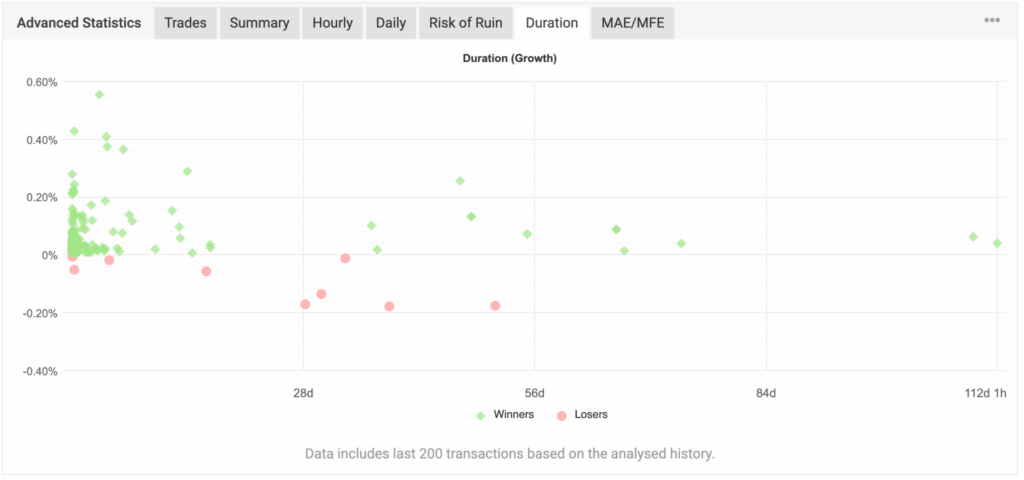
The average holding time data helps show how long trades remained open during the month.
This matters because trade duration affects the way a trading account feels in real time.
Some trades may close quickly. Others may remain open longer before resolving. When trades stay open longer, the account can experience more visible movement. That movement may include floating profit, floating drawdown, or simply a period where the trade needs more time.
In the April dashboard, holding times varied by pair. Some trades resolved more quickly, while others remained open for longer periods.
For someone newer to automated trading, this is important to understand.
Automation does not mean every trade closes instantly. It does not mean the account moves upward every day. It does not mean there will never be waiting periods.
The software still operates in live market conditions. Markets move in waves, and trades may need time to develop.
This is why patience matters when evaluating a trading strategy. The result at the end of the month matters, but the path to that result can include normal market fluctuation.
INTRADAY AND DAY-OF-WEEK DISTRIBUTION

The Hourly tab helps show when trading activity was most productive in the broader analyzed view.
According to the uploaded chart, the strongest concentration of outcomes appeared later in the trading day, especially around the late afternoon and early evening hours. The standout hour in the displayed chart was 17:00, followed by strong activity around 16:00 and 18:00.
This does not mean those hours will always perform best in the future. It also does not mean the strategy only works during those times.
However, it does help show how the account behaved in the reported data.
For newer readers, this section can be thought of as a timing profile. It shows that trading activity was not evenly distributed across every hour of the day.
For experienced traders, this may be useful when evaluating market sessions, liquidity windows, and strategy behavior during different parts of the trading day.
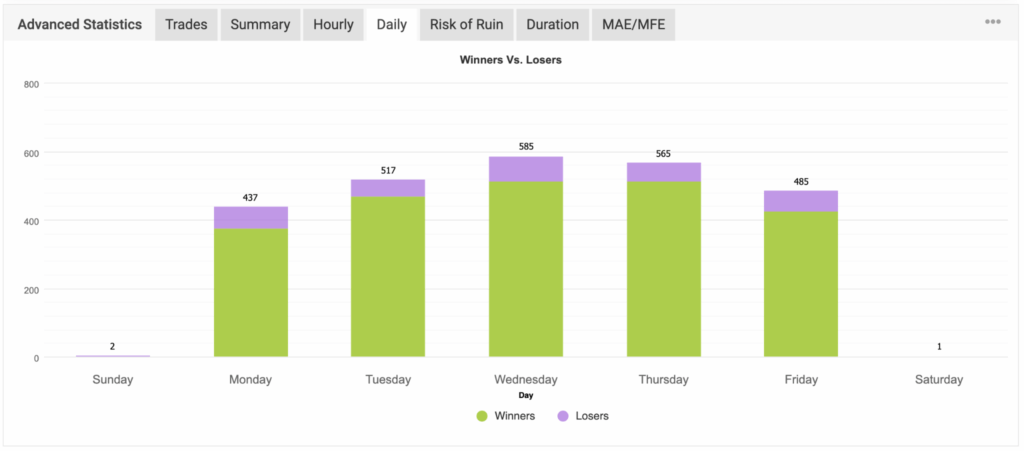
The Daily tab gives a similar view, but instead of looking at hours, it looks at days of the week.
In the uploaded screenshot, the strongest activity appeared midweek. Wednesday showed the highest visible total, followed closely by Thursday. Tuesday and Friday also contributed strongly, while weekend activity was minimal in the displayed chart.
Again, this is not a forecast.
It does not mean future Wednesdays will always perform best. It simply gives more context about how the account behaved in the reporting sample.
This type of data is helpful because it makes the report more complete. It allows readers to see the rhythm of the trading activity instead of only looking at the final monthly number.
MAE/MFE: Understanding Trade Movement
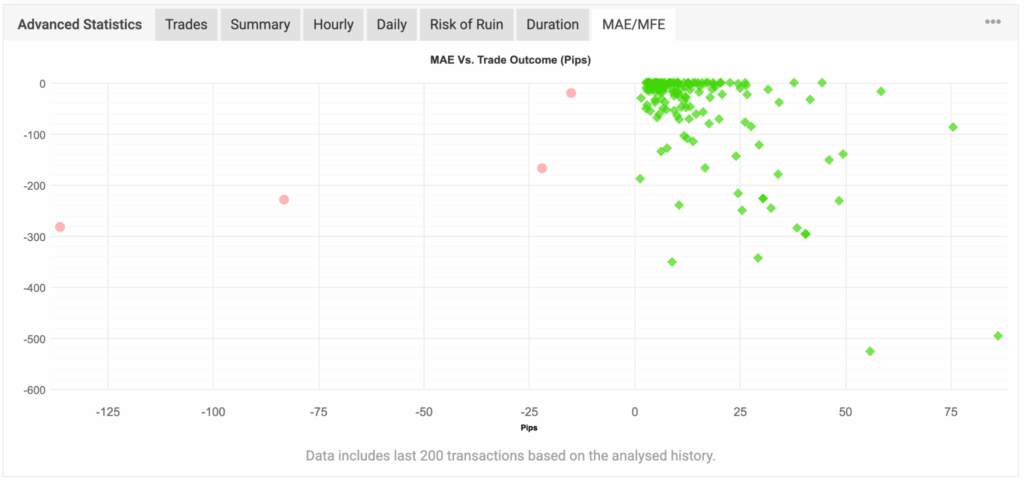
The MAE/MFE chart adds another layer of detail.
MAE stands for Maximum Adverse Excursion. In simple terms, it shows how far a trade moved against the position before closing.
MFE stands for Maximum Favorable Excursion. It shows how far a trade moved in favor of the position before closing.
For newer readers, this chart helps answer a practical question:
How much did trades move around before they finished?
In the uploaded chart, many winning trades appeared closer to the center, suggesting that many outcomes were relatively controlled. At the same time, there were still trades that showed deeper movement.
That matters because even profitable trading strategies can include trades that move against the account before they close.
This is why risk language is not just legal wording. It is part of understanding the trading process.
A month can be positive, the technology can perform well, and the strategy can still experience real market movement.
WHY APRIL 2026 MATTERS
April 2026 was a constructive month for FGP1 based on the Myfxbook reporting.
The Monthly Analytics dashboard showed a 5% result for April. The broader account view showed continued progress over time. The account also maintained a visible risk profile, with drawdown and trade behavior clearly shown in the screenshots.
That combination is important.
The positive performance should be recognized, but it should also be understood responsibly.
For someone considering the PAMM, April gives another example of how the strategy performed in a live trading environment.
For someone evaluating automated trading more broadly, April also shows why it is important to look at verified reporting, account behavior, drawdown, and trade distribution before making a decision.
That does not mean every month will look like April. It does not mean results are guaranteed. But it does show why FGP1 continues to be worth reviewing for qualified participants who understand the risks.
FGP1 AND TRADITIONAL INVESTMENT TOOLS
FGP1 should be understood in the correct category.
It is not the same as a savings account. It is not the same as a CD. It is not the same as a bond. It is not the same as a long-term index fund.
Those tools serve different purposes.
Savings accounts and CDs are typically focused on stability and preservation. Bonds carry their own interest-rate and market risks. Index funds provide broad exposure to public equities over longer periods.
FGP1 operates in the active forex trading space.
That means the return profile can be different. The drawdown profile can be different. The account behavior can be different. The potential opportunity is different, but so is the risk.
The better question is not whether FGP1 is simply “better” or “worse” than traditional financial tools.
A better question is:
Does this type of active trading exposure fit what I am looking for, and do I understand the risks?
For the right person, FGP1 may be an attractive way to participate in an automated trading strategy without needing to personally manage every trading decision.
READING APRIL RESPONSIBLY
The best way to read April is to keep several facts in view at the same time.
The Monthly Analytics dashboard showed a 5% result for April. The General panel showed 18.61% drawdown at the time of capture. The broader account snapshot showed strong cumulative gain and absolute gain. The visible trade history was spread across several forex pairs. The April asset mix leaned most heavily toward USDCHF and EURUSD. Holding-time data showed that not all trades behaved the same way. Risk statistics looked strong in the uploaded platform view, but they still require conservative interpretation.
When these points are read together, April becomes easier to understand.
It was a positive month. It was also a real trading month.
It included opportunity, movement, trade duration, drawdown context, and risk.
That is exactly why transparent reporting matters.
What Powers These Results?
The Myfxbook screenshots above show the performance data, trade behavior, drawdown, pair activity, and account movement for FGP1.
But a natural question many readers may ask is:
What technology is being used behind the scenes?
FGP1 uses a combination of Auvoria Prime’s automated trading technology, including two of our core forex software products: Kraitos Elite and GearBox.
These tools are part of the Auvoria Prime ecosystem and are designed to help users participate in forex trading through automation, structured logic, and disciplined trade management.
For readers who are interested in the results shown above, there are two possible paths to consider.
One path is joining the FGP1 PAMM, where qualified participants can participate in a managed structure.
The other path is purchasing the software and using the technology directly through an Auvoria Prime subscription.
Kraitos Elite
Kraitos Elite is an automated forex trading software designed to identify, enter, manage, and close trades using structured strategy logic.
It is built for users who want a more automated approach to forex trading instead of manually sitting in front of charts looking for entries.
Kraitos Elite uses predefined trading logic, market conditions, and automated trade management to help execute a more disciplined trading approach.
This may appeal to users who want access to automation while still maintaining control over their own trading account, software setup, broker connection, and risk settings.
GearBox
GearBox is another automated forex trading software in the Auvoria Prime ecosystem.
It is designed for users who want intelligent automation, built-in trade management features, and a more hands-free way to participate in the forex market.
GearBox may be appealing to people who want trading technology working for them without needing to manually analyze every chart, setup, and entry.
For users who prefer the software path instead of the PAMM path, GearBox may be worth reviewing as part of your overall automated trading setup.
Important Geographic Restriction
FGP1 is not available to U.S. persons or U.S. residents.
If you are outside the restricted regions and are interested in participating in the PAMM, you can request more information and review whether the service is available in your location.
If you are in a restricted region for the PAMM, you may still ask about Auvoria Prime’s software options, including Kraitos Elite and GearBox, where available and permitted.
Final Thoughts
April 2026 was a strong and constructive month for FGP1 based on the Myfxbook results reviewed above.
The monthly result is encouraging, but the deeper value is found in the full picture: account history, drawdown context, pair distribution, trade duration, risk statistics, and transparent reporting.
For someone who wants a more hands-off approach, the FGP1 PAMM may be worth exploring.
For someone who wants to use the technology directly, Kraitos Elite and GearBox offer a way to access Auvoria Prime’s automated forex software through a personal subscription and software setup.
Either way, the key is to make an informed decision.
Review the results. Understand the risk. Choose the path that best fits your goals.
Final Risk Disclosure
This content is for informational purposes only and does not constitute investment advice, financial advice, or a solicitation. Trading involves substantial risk, and loss of principal is possible. Past performance is not indicative of future results, and no guarantees are made. Participation in FGP1 is geographically restricted and is not available to U.S. persons or U.S. residents.

London Session Forex Time: Everything Traders Need to Know About
The foreign exchange market operates 24 hours a day, five days a week. While trading is possible around the clock,…

FGP1 June 2026 Performance Overview
Geographic Restriction & Risk Notice FGP1 is geographically restricted and is not available to U.S. persons or residents. Trading involves substantial…

Best Day Trading App: What Traders Should Look for Before
Day trading has become more accessible than ever. With the rise of mobile technology, cloud-based platforms, and real-time market data,…

Top Stock Brokers: How to Choose the Right Platform for
Choosing from the top stock brokers can feel overwhelming. There are many platforms, account types, tools, fees, apps, and trading…
Currency Strength Meter: How Traders Use Currency Strength to Read
What Is a Currency Strength Meter? A currency strength meter is a trading tool that helps traders compare the relative strength…

Commodity Prices Today: How Traders Can Read Market Movement With
Introduction Commodity prices today can move quickly. Oil, gold, silver, copper, wheat, corn, natural gas, and other raw materials can all…
