Geographic Restriction & Risk Notice
FGP1 is geographically restricted and is not available to U.S. persons or residents. Trading involves substantial risk, including possible loss of principal. Past performance is not indicative of future results. This material is informational only and does not constitute investment advice, an offer, or a solicitation.

Why we publish monthly reports (and why “risk-first” matters)
FGP1’s March 2026 performance overview is based on the uploaded Myfxbook reporting screenshots for the month and is presented in a risk-first format designed to prioritize transparency over promotion.
This report is intended to document the month as shown in the reporting data, while placing equal weight on performance, drawdown, trade behavior, and overall context. The goal is not to spotlight a headline figure in isolation, but to present the month in a way that is factual, conservative, and useful to readers who want a clearer picture of how the strategy behaved.
March 2026 at a Glance

The March reporting set showed a constructive month for FGP1, with the uploaded account data reflecting a positive monthly result alongside meaningful drawdown. That combination matters. A monthly report should never be read through return alone. The return tells only part of the story, while the drawdown helps frame the path that was required to produce it.
For that reason, this report treats the month as a full performance profile rather than a headline number. The reported gain, the drawdown shown in the account analytics, and the broader trade statistics all need to be read together.
Equity Progression Through the Month

The equity progression screenshot helps show how the month developed over time rather than only where it finished. In March, the uploaded chart showed that the performance curve advanced through the reporting period instead of relying on a single isolated move. That does not eliminate risk, but it does help show that the month’s outcome was built progressively.
This is also where readers should pay attention to shape rather than just outcome. A steadily advancing curve, pauses in progression, and any accelerations later in the month all provide useful context. Monthly reporting becomes more meaningful when readers can see not only the end result, but also how the account moved over time.
Trade Quality and Core Statistical Context

The Summary tab provides some of the most useful context in the entire monthly reporting set because it helps move the conversation away from marketing language and back toward measurable behavior.
This section shows how the trade distribution, expectancy, profit factor, commissions, average win and average loss, and average trade length all interacted during the month. In a responsible review, these metrics matter because they help reveal whether the result came from a broad body of trade activity, whether trade expectancy remained constructive, and how losses compared to wins on an average basis.
This is especially important in months where the top-line return looks strong. A strong month can still contain meaningful risk, larger average losses than wins, or long-duration outliers that deserve attention. The Summary screenshot should therefore sit at the center of the analytical portion of the article.
Pair-Level Contribution
The Trades tab gives a clearer view of which markets contributed most to the month and which ones detracted. That pair-level detail matters because it shows whether performance was broad-based or concentrated, and whether any one market stood out as unusually strong or unusually weak.
For March, the uploaded trade table showed that the strategy’s activity was distributed across several major currency pairs, with some pairs contributing more heavily than others. It also showed that not every traded asset finished the month in positive territory. That is important to say clearly, because conservative reporting should reflect the full picture rather than smoothing over weaker areas.
A month with a positive overall outcome can still include individual markets that underperformed. Including the trades screenshot here lets readers see that directly rather than relying on a simplified summary.
Asset Mix and Monthly Analytics
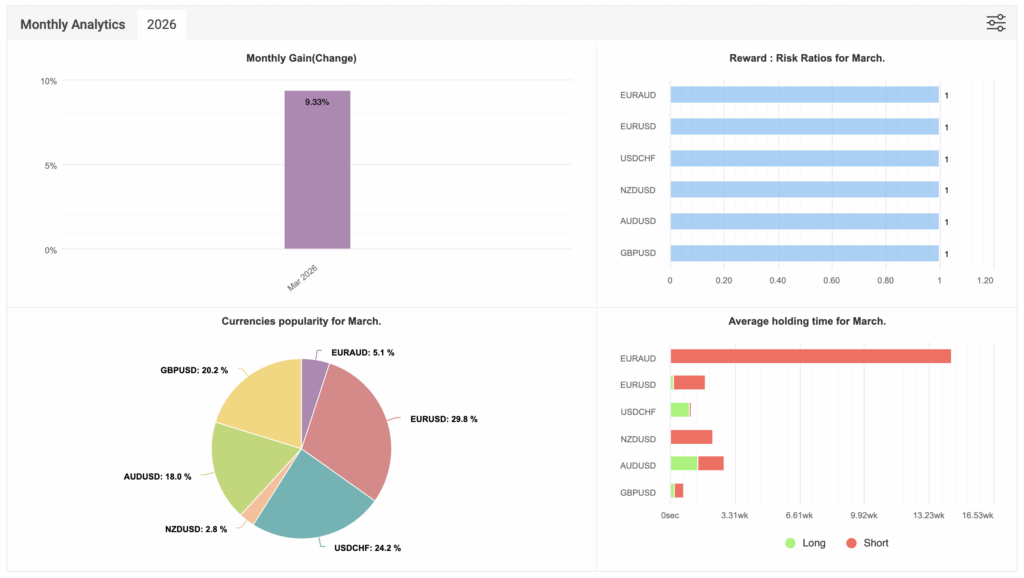
The Monthly Analytics dashboard brings together the broader structure of the month. It shows the reporting month itself, the asset popularity mix, the reward-to-risk display by pair, and average holding time across the traded instruments.
This section is useful because it helps identify where the strategy was most active. Rather than describing the month as generic forex activity, the dashboard shows which assets occupied the largest share of attention during the reporting period. That helps give readers a better sense of the month’s actual composition.
It also adds context to duration. A strategy’s average holding behavior can shape how the equity curve feels in practice, how often trades remain open, and how long exposures may stay active before resolving. This is one more reason the report should be read as a full behavioral snapshot, not just a return summary.
Intraday Trade Distribution
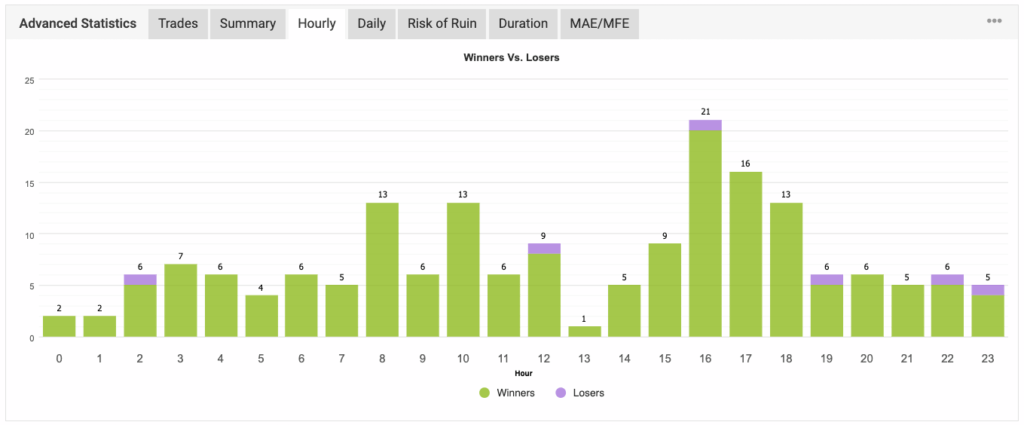
The Hourly view shows when winning and losing trades were distributed throughout the day. This can help identify whether performance was scattered randomly or whether the month’s results clustered in more defined time windows.
That kind of data is useful because it adds another layer of process context. Even without making any forecasts or assumptions, readers can still observe whether the strategy’s activity appears more concentrated during certain hours and whether those periods were associated with more favorable trade outcomes.
This is the sort of detail that improves the quality of a monthly report. It shifts attention toward structure and discipline rather than simply repeating that the month closed positive.
Risk of Ruin and Risk Interpretation
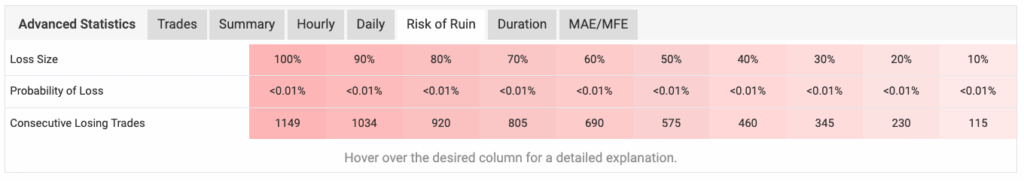
The Risk of Ruin tab provides one more analytical layer, but it should always be interpreted conservatively. Platform-generated risk statistics can be informative, but they are not guarantees and should never be treated as certainty.
That point matters because risk statistics often look more reassuring than real-world trading behavior may justify. Any probability-based display should be read as a model output within the reporting platform, not as a promise about future account behavior. The real purpose of including this screenshot is transparency. It allows readers to see the platform’s own risk display while still understanding that all trading involves uncertainty and loss potential.
Holding Duration and Outlier Awareness

The Duration view is especially helpful because it gives a more realistic picture of how long trades remained active and whether the month included longer-duration outliers. In practical terms, duration matters because long-held positions can affect account behavior differently than short-held positions.
This screenshot can help readers identify whether most activity remained clustered in a shorter holding range or whether a few trades extended far beyond the rest. Those kinds of outliers can influence both equity progression and the lived experience of following a strategy.
Including duration in a monthly report also reinforces the central theme of this format: one number should never stand alone.
Reading March Responsibly
March should be viewed as a positive reporting month for FGP1 based on the uploaded analytics, but it should also be read with discipline. The proper way to interpret the month is to hold together all of the following at once:
- the reported monthly result,
- the drawdown shown in the reporting panel,
- the trade behavior visible in the summary statistics,
- the pair-level contribution shown in the trades tab,
- the asset mix from the monthly dashboard,
- and the timing and duration context from the hourly and duration views.
That fuller perspective is what makes a monthly report useful. Without it, performance commentary can become selective. With it, readers can judge the month on a more informed basis.
FGP1 and Traditional Investment Tools
It is also important not to compare a strategy like FGP1 to savings accounts, CDs, bonds, or index funds in a simplistic way. These are different financial tools with different risk structures, objectives, and expectations.
A savings account or CD is generally associated with capital preservation and predictability. Bond exposure introduces a different type of market risk and income profile. Broad index funds are typically used for long-term public market exposure. A traded forex strategy operates differently from all of those. It may produce months that look very different from traditional instruments, but it also carries a materially different risk profile and should be understood on those terms.
For that reason, this report is best read as a performance record and risk commentary, not as a comparison piece or a claim of superiority over more traditional financial options.
Final Thoughts
The March 2026 reporting set gave a useful example of why transparent monthly reporting matters. The uploaded screenshots showed a positive month, but they also showed why serious readers should pay attention to drawdown, duration, asset distribution, and trade behavior rather than focusing on one figure in isolation.
That is the standard this report is meant to follow. The numbers matter, but the context around them matters just as much.
To follow the full March 2026 performance overview for FGP1, visit:

London Session Forex Time: Everything Traders Need to Know About
The foreign exchange market operates 24 hours a day, five days a week. While trading is possible around the clock,…
FGP1 June 2026 Performance Overview
Geographic Restriction & Risk Notice FGP1 is geographically restricted and is not available to U.S. persons or residents. Trading involves substantial…
Best Day Trading App: What Traders Should Look for Before
Day trading has become more accessible than ever. With the rise of mobile technology, cloud-based platforms, and real-time market data,…
Top Stock Brokers: How to Choose the Right Platform for
Choosing from the top stock brokers can feel overwhelming. There are many platforms, account types, tools, fees, apps, and trading…
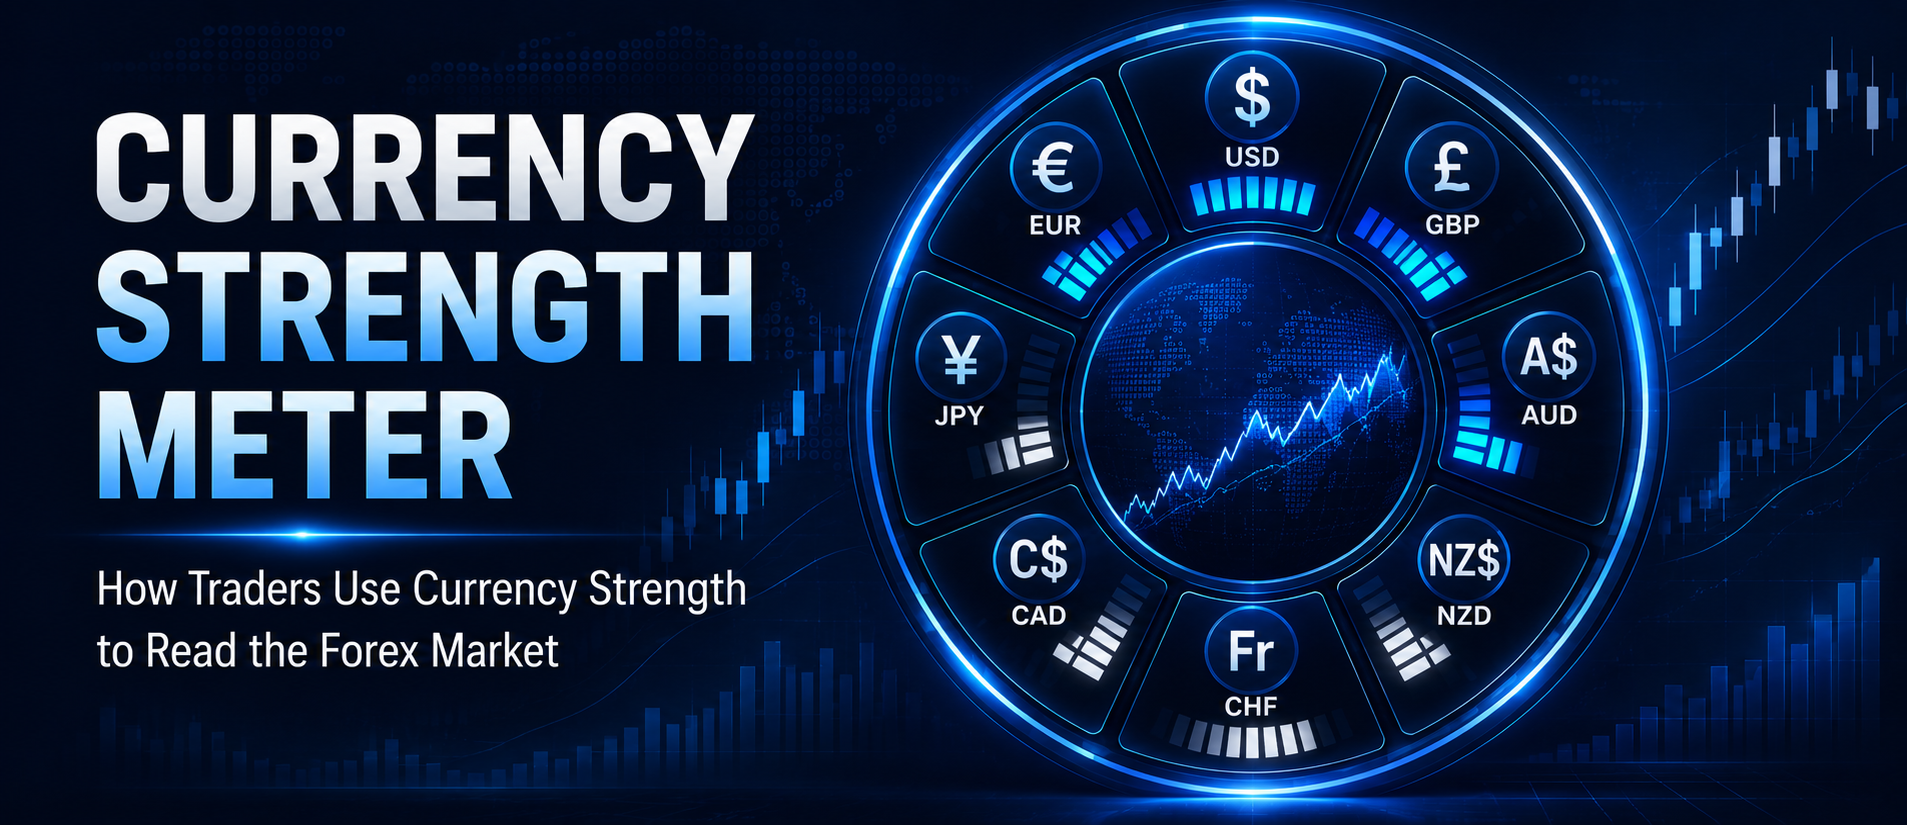
Currency Strength Meter: How Traders Use Currency Strength to Read
What Is a Currency Strength Meter? A currency strength meter is a trading tool that helps traders compare the relative strength…

Commodity Prices Today: How Traders Can Read Market Movement With
Introduction Commodity prices today can move quickly. Oil, gold, silver, copper, wheat, corn, natural gas, and other raw materials can all…
