

Geographic Restriction & Risk Notice
FGP1 is geographically restricted and is not available to U.S. persons or residents. Trading involves substantial risk, including possible loss of principal. Past performance is not indicative of future results. This material is informational only and does not constitute investment advice, an offer, or a solicitation.
JUNE 2026 AT A GLANCE
The first point to note in this FGP1 June 2026 performance overview is that the Monthly Analytics dashboard showed a 0.42% result for June 2026.
This result was lower than normal. However, June was affected by two important events that should be considered when reviewing the month.
- GearBox experienced an approximately 2.3% loss on USDCAD.
- A technological issue occurred while the trading account was being transferred, requiring trading to be paused for approximately three weeks.
The account-transfer issue also caused losses that were not part of the strategy’s intended market activity. After the issue was reviewed, InvidiaTrade reversed the losses connected to the transfer problem.
That reversal should be understood as an operational correction rather than trading profit. The GearBox USDCAD loss was separate. It was a genuine trading result and remained part of June’s normal market performance.
Because trading was paused for most of the month, June did not represent a normal full month of trading activity. The final result should therefore be read in the context of both the USDCAD loss and the reduced amount of time available for the strategy to trade.
MONTHLY PROGRESSION THROUGH JUNE
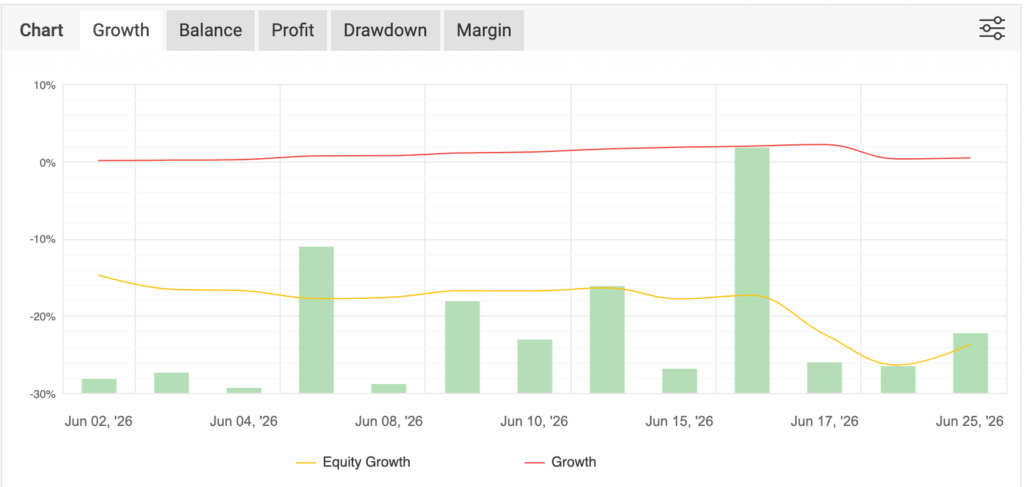
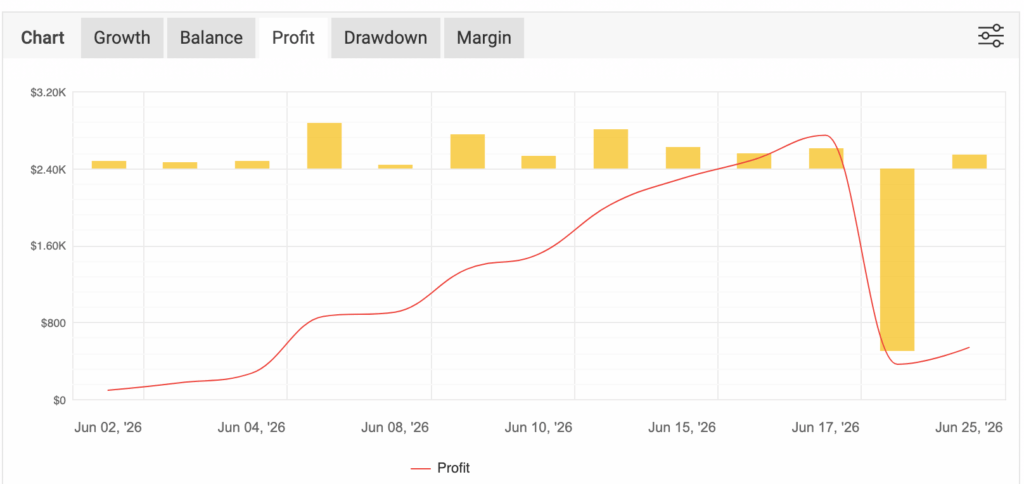
The June-specific chart helps show how the month developed. The red growth line remained slightly positive, while the yellow equity-growth line experienced more pressure and moved lower during the second half of the month.
This difference matters because closed performance and open equity do not always move together. A strategy can show a positive reported monthly result while open positions continue to create temporary pressure on account equity.
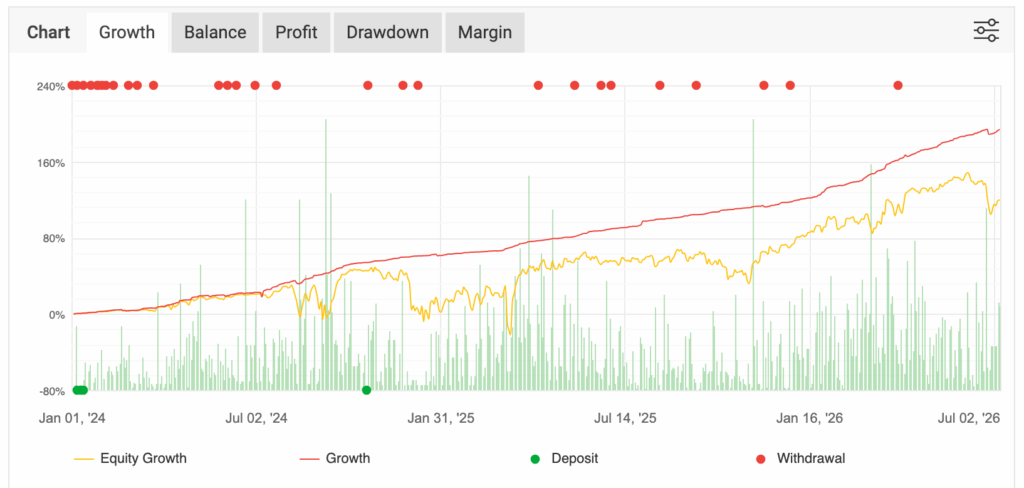
The broader account chart provides additional context. The longer-term growth line continued to show upward progression across the wider reporting period. However, the equity line remained more variable and included several meaningful pullbacks.
In practical terms, June was a more difficult month than May. The account remained positive for the month, but the USDCAD loss, open-equity movement, and three-week trading pause all affected the final result.
CURRENT JUNE ADVANCED STATISTICS SNAPSHOT
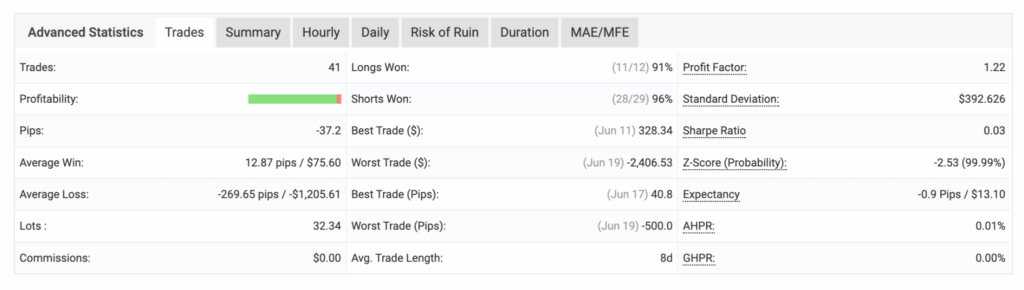
The Advanced Statistics Summary tab gives a clear month-specific snapshot for June. The uploaded Summary tab showed:
- Trades: 41
- Pips: -37.2
- Profit Factor: 1.22
- Average Win: 12.87 pips / $75.60
- Average Loss: -269.65 pips / -$1,205.61
- Average Trade Length: 8 days
The same Summary tab also showed:
- Longs Won: 11 / 12 or 91%
- Shorts Won: 28 / 29 or 96%
- Best Trade: $328.34
- Worst Trade: -$2,406.53
- Sharpe Ratio: 0.03
- Expectancy: -0.9 pips / $13.10
This is one of the most important sections in the June 2026 performance overview. The visible win percentages remained high. However, the average loss was considerably larger than the average win.
That helps explain why June produced only a modest positive result despite most trades being profitable. A high win rate does not eliminate risk when one losing trade is significantly larger than the typical winner.
The June statistics provide a clear reminder that win rate should never be considered by itself. The size of individual losses can have a much greater effect than the total number of winning trades.
PAIR-LEVEL CONTRIBUTION IN JUNE
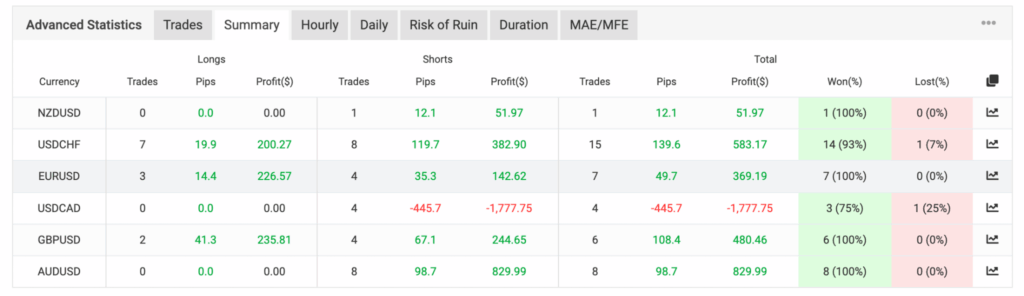
The Trades tab gives a pair-by-pair view of how June was built. This is especially useful because it shows which markets contributed positively and which pair had the greatest negative effect.
In the uploaded June Trades tab, positive contributions were shown from:
- AUDUSD
- USDCHF
- GBPUSD
- EURUSD
- NZDUSD
The primary negative contribution came from USDCAD.
The visible USDCAD row showed:
- Four trades
- Three winning trades
- One losing trade
- -445.7 total pips
- -$1,777.75 total contribution
This is consistent with the approximately 2.3% GearBox USDCAD loss reported for June.
The screenshot also demonstrates why a strong win percentage does not always result in strong monthly performance. Three of the four visible USDCAD trades were profitable. However, the single losing trade was large enough to leave the pair materially negative overall.
The remaining displayed pairs helped offset part of that loss and allowed June to finish slightly positive.
JUNE 2026 ASSET MIX AND MONTHLY ANALYTICS
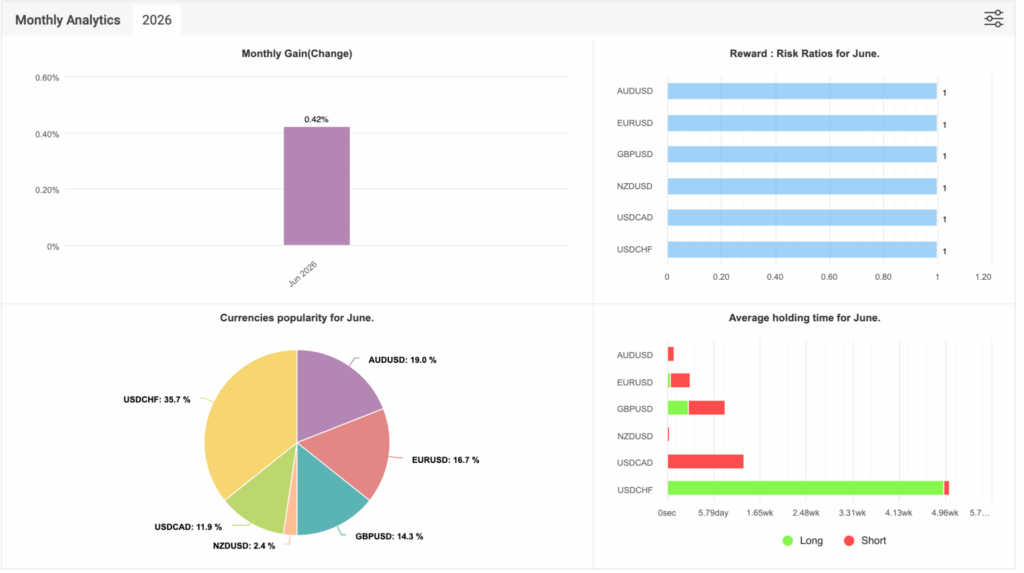
The Monthly Analytics dashboard gives the clearest month-specific breakdown in the uploaded set. For June 2026, the dashboard showed a 0.42% monthly result and a Reward : Risk reading of 1 across the listed currency pairs.
The dashboard also showed the June asset popularity mix:
- USDCHF: 35.7%
- AUDUSD: 19.0%
- EURUSD: 16.7%
- GBPUSD: 14.3%
- USDCAD: 11.9%
- NZDUSD: 2.4%
This section matters because it shows how June was distributed. In the uploaded analytics, USDCHF accounted for the largest visible share of activity, followed by AUDUSD and EURUSD.
USDCAD represented a smaller percentage of total activity. However, it still produced the month’s most significant negative contribution. This is another reminder that activity share and financial impact are not always the same.
AVERAGE HOLDING TIME AND TRADE DURATION
The holding-time data adds another useful layer to this FGP1 June 2026 performance overview. From the Monthly Analytics dashboard, average holding times varied significantly by pair.
The clearest example was USDCHF, which showed the longest visible holding-time profile among the displayed pairs. USDCAD also showed a more extended holding period than several of the other markets.
By comparison, AUDUSD, EURUSD, GBPUSD, and NZDUSD showed shorter visible holding periods.
That matters because longer holding times can increase the difference between closed performance and open equity. A position may eventually close profitably while still creating meaningful equity fluctuation during the time it remains open.
The eight-day average trade length shown in the Summary tab further supports the view that June included positions that remained open for an extended period.
HOURLY AND DAILY DISTRIBUTION
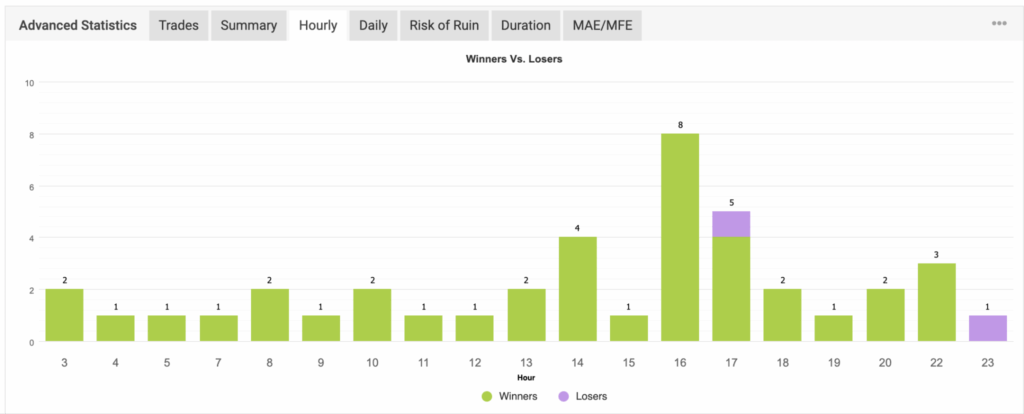
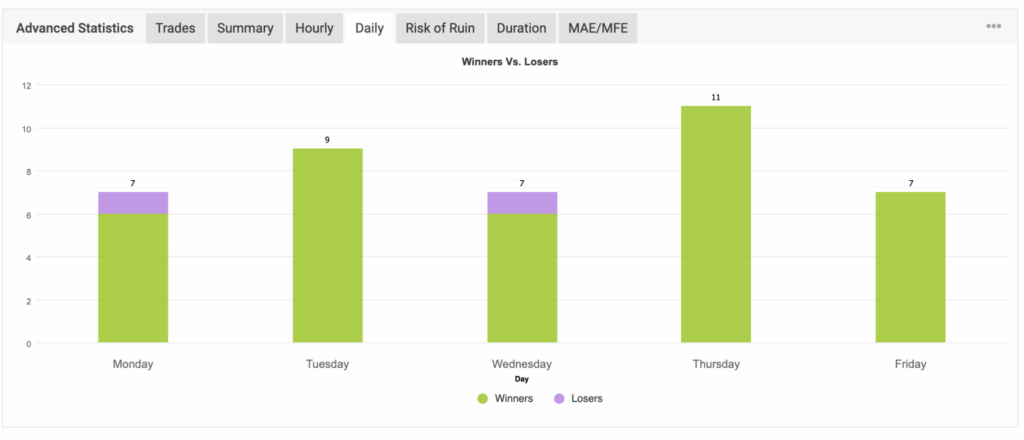
The Hourly and Daily tabs add more process context to the June report.
In the uploaded Hourly view, the strongest visible concentration of winning trades appeared around 16:00, which recorded eight winners. Other active periods included 14:00, 17:00, and 22:00.
The Hourly chart also showed visible losing outcomes around 17:00 and 23:00.
The Daily tab showed that Thursday had the highest visible trade count, followed by Tuesday. Monday and Wednesday each included one visible losing trade, while the remaining displayed weekdays showed winners only.
These sections do not provide a forecast. However, they help show how June’s activity was distributed across the trading day and week.
RISK OF RUIN AND RISK INTERPRETATION

The Risk of Ruin tab requires careful interpretation.
The uploaded platform view showed probabilities below 0.01% for several of the larger loss thresholds. However, the modeled probability increased as the loss threshold became smaller.
The visible estimates included:
- 40% loss threshold: 0.02%
- 30% loss threshold: 0.28%
- 20% loss threshold: 2.55%
- 10% loss threshold: 17.7%
These figures are platform-generated statistical estimates. They are not guarantees, predictions, or promises about future account behavior.
June provides a practical reason to interpret these numbers conservatively. The strategy showed high win percentages, but one materially larger loss still had a significant effect on the month.
MAE AND TRADE-OUTCOME DISTRIBUTION
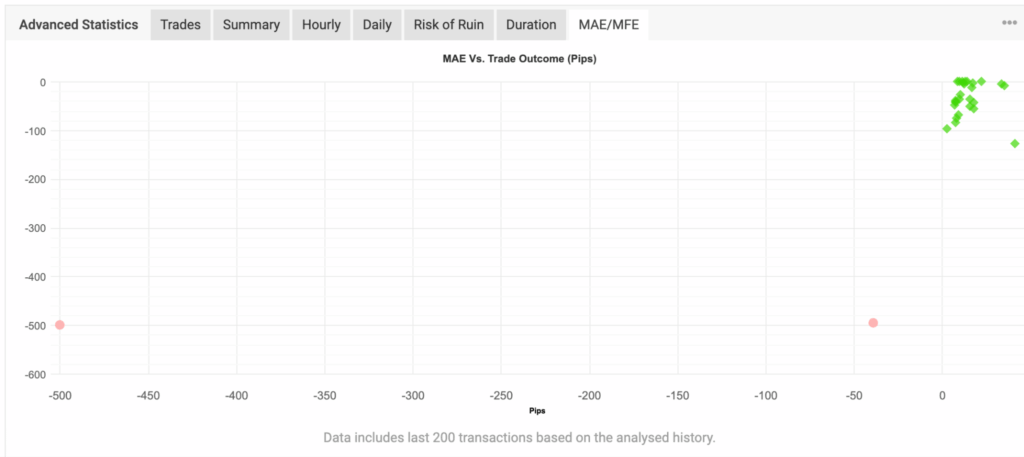
The MAE chart provides a visual view of the difference between June’s winners and losers.
Most of the winning trades clustered in a relatively contained area. However, the losing observations were positioned much farther away from the primary winner group.
That supports the same conclusion shown in the Summary and Trades tabs:
- Most trades were profitable.
- Losing trades were limited in number.
- The losing trades were significantly larger than the typical winners.
- Loss size had a greater effect than loss frequency during June.
This is why transparent monthly reporting should include more than a win rate or final percentage.
FGP1 AND TRADITIONAL INVESTMENT TOOLS
It is also important to compare FGP1 to traditional financial tools in the right way.
Savings accounts, CDs, bonds, and index funds all serve different purposes. In general:
- Savings accounts and CDs are built around stability and capital preservation.
- Bonds carry their own credit, market, and interest-rate risks.
- Index funds provide broad public market exposure over longer time frames.
By contrast, FGP1 operates in active forex trading. That means the return pattern, drawdown profile, open-equity movement, and risk characteristics can look very different from those traditional tools.
Therefore, the appropriate framing is not “better” or “worse.” These are simply different risk profiles.
READING JUNE RESPONSIBLY
The best way to read June is to keep several facts in view at the same time:
- The Monthly Analytics dashboard showed a 0.42% result for June.
- GearBox experienced an approximately 2.3% USDCAD loss.
- Trading was paused for approximately three weeks because of a technological issue during an account transfer.
- InvidiaTrade reversed losses connected to the transfer issue.
- That reversal was an operational correction, not trading profit.
- The visible June sample showed 41 trades.
- The account recorded -37.2 pips.
- Most displayed currency pairs contributed positively.
- USDCAD was the primary negative contributor.
- High win percentages did not remove the effect of one materially larger loss.
When these points are read together, the month makes more sense. June was positive, but it was not a normal month
of uninterrupted trading activity.
FINAL THOUGHTS
This FGP1 June 2026 performance overview showed a modest positive month under unusual circumstances.
June included a genuine USDCAD trading loss, a technological issue during an account transfer, an operational correction by InvidiaTrade, and approximately three weeks without active trading.
The result can still be acknowledged. However, the month should be understood in full context rather than reduced to its final percentage.
For readers who value transparent reporting, that is the purpose of this update. It is not to remove risk from the discussion. It is to present June accurately and responsibly.
FINAL RISK DISCLOSURE
This content is for informational purposes only and does not constitute investment advice, financial advice, or a solicitation. Trading involves substantial risk, and loss of principal is possible. Past performance is not indicative of future results, and no guarantees are made. Participation is geographically restricted and is not available to U.S. persons or U.S. residents.

Best Robo Advisors: A Complete Guide to Automated Investing
Choosing how to invest has become easier than ever thanks to technology. One of the biggest innovations in recent years…

Best Day Trading App: What Traders Should Look for Before
Day trading has become more accessible than ever. With the rise of mobile technology, cloud-based platforms, and real-time market data,…
FGP1 July 2026 Performance Overview
Geographic Restriction & Risk Notice FGP1 is geographically restricted and is not available to U.S. persons or residents. Trading involves substantial…

London Session Forex Time: Everything Traders Need to Know About
The foreign exchange market operates 24 hours a day, five days a week. While trading is possible around the clock,…
FGP1 June 2026 Performance Overview
Geographic Restriction & Risk Notice FGP1 is geographically restricted and is not available to U.S. persons or residents. Trading involves substantial…

AI Stock Trading: How Artificial Intelligence Is Changing the Way
Artificial intelligence is transforming industries around the world, and financial markets are no exception. What once required hours of chart…
