
FGP1 continued its positive monthly performance in October 2026, closing the month with a +3.30% gain. The strategy completed 36 trades, generated 504.1 pips, and achieved an 89% overall win rate. A profit factor of 4.02 also highlighted the positive results from closed trades.
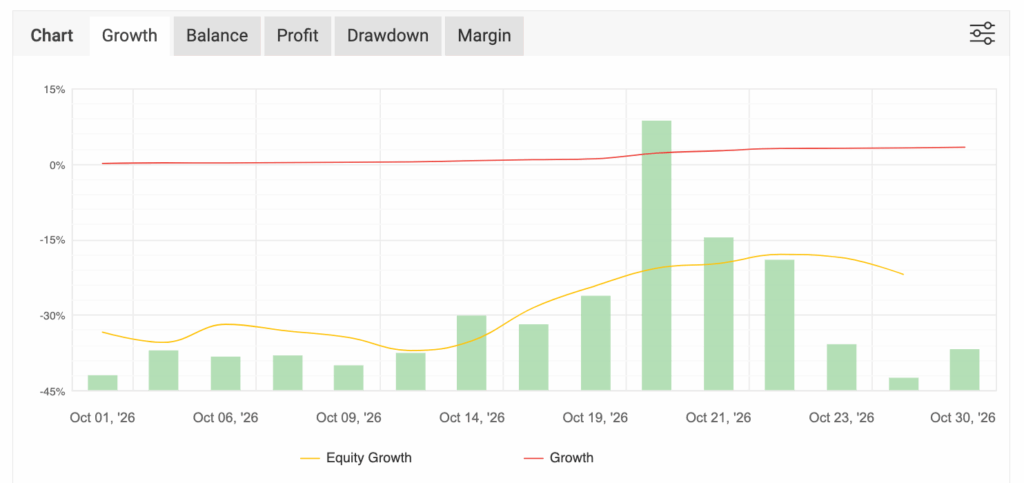
The growth chart shows how FGP1’s closed-trade performance developed throughout October. Growth remained relatively steady during the first half of the month before accelerating around October 20. However, the equity growth line remained negative, reflecting significant unrealized exposure. This distinction is important when evaluating overall account risk.
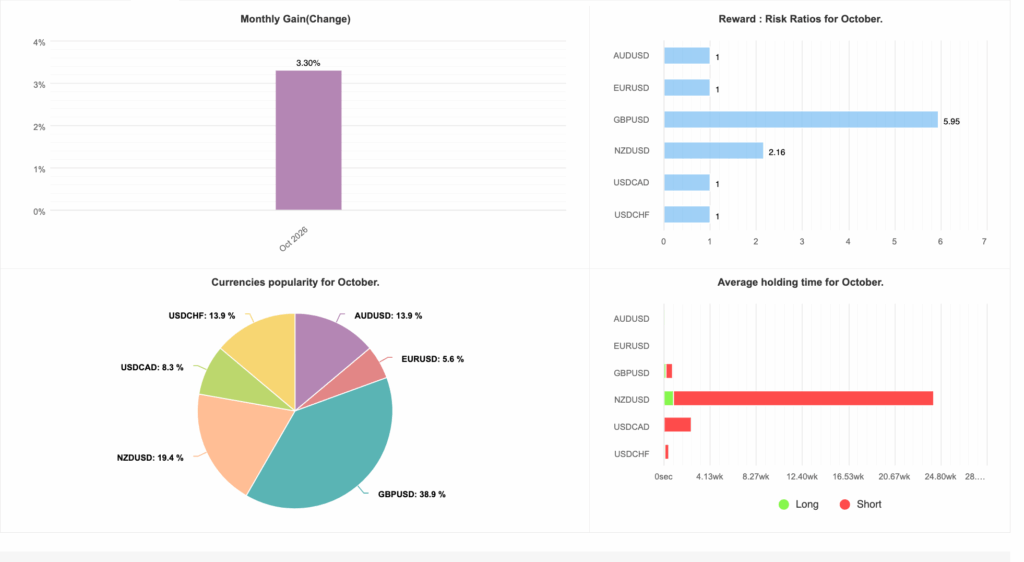
The monthly analytics panel confirms October’s +3.30% gain. GBPUSD accounted for the largest share of trading activity, followed by NZDUSD. The report also shows differences in holding times and reward-to-risk ratios across currency pairs.
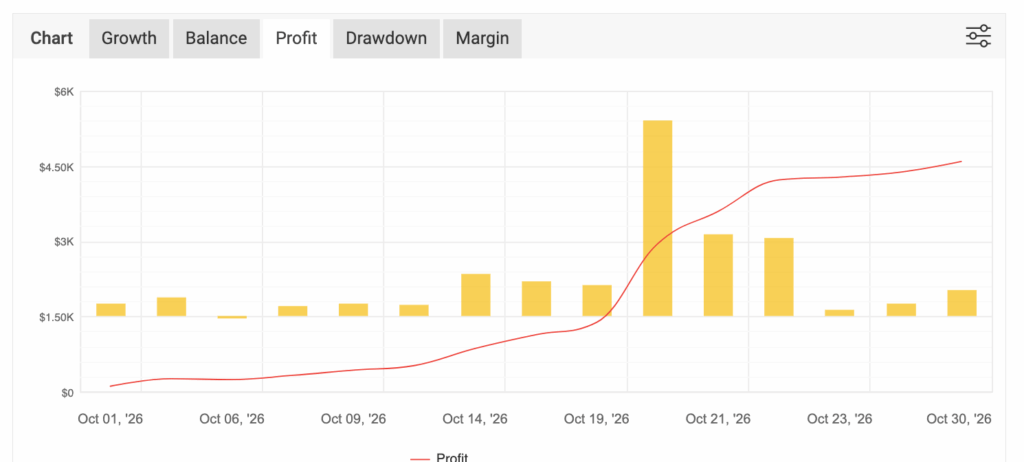
The profit chart shows how realized trading profits accumulated throughout October. The strongest increase occurred around October 20, followed by additional gains toward the end of the month. Overall, the chart finished with approximately $4,600 in cumulative closed-trade profit.
Trading Statistics
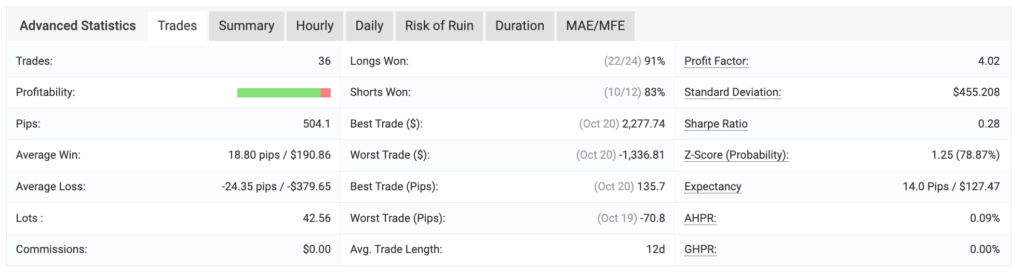
FGP1 completed 36 trades in October, generating 504.1 pips. Long positions recorded 22 wins out of 24 trades, while short positions achieved 10 wins out of 12. Together, these results produced an 89% overall win rate and a profit factor of 4.02.
Additional key statistics from October include:
- Average win: 18.80 pips / $190.86
- Average loss: -24.35 pips / -$379.65
- Best trade: 135.7 pips / $2,277.74
- Worst trade: -70.8 pips / -$1,336.81
- Average trade length: 12 days
- Sharpe ratio: 0.28
- Commissions: $0.00
The statistics reflect positive closed-trade performance. However, the size of the largest loss and the difference between balance growth and equity growth remain important considerations.
Hourly Performance
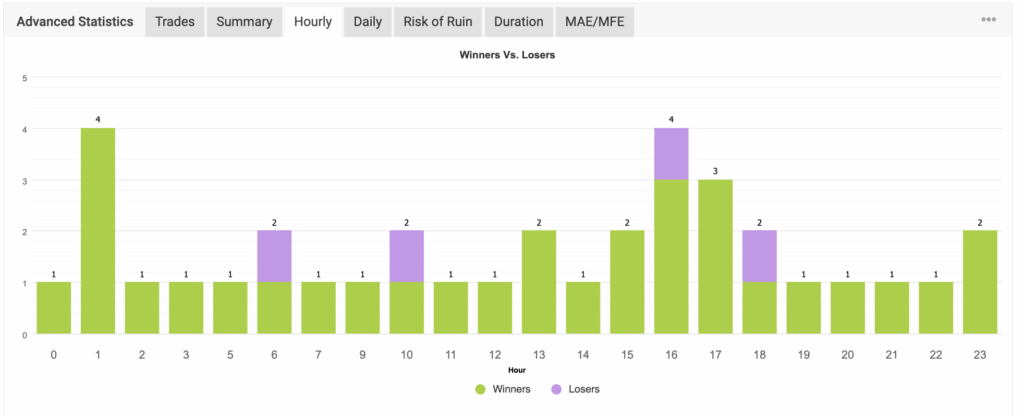
The hourly breakdown shows that FGP1 found opportunities throughout the trading day. The strongest winning activity appeared around 01:00, 16:00, and 17:00, with four winners recorded at 01:00 and three winners each at 16:00 and 17:00. This suggests that the strategy continued to identify opportunities across different trading sessions.
Daily Performance
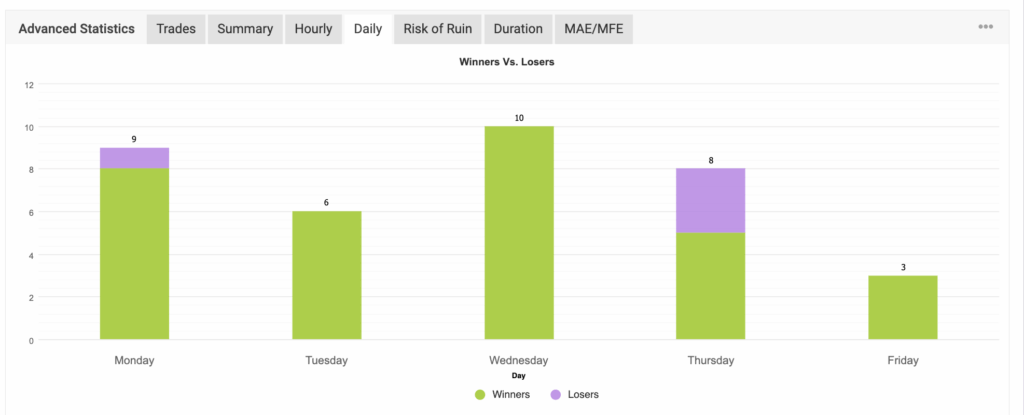
Looking at results by day, Wednesday was the strongest day of the week, recording 10 winning trades. Monday followed with 8 winners from 9 trades, while Tuesday recorded 6 winners. Thursday experienced the highest number of losing trades, although it still closed with five winners from eight trades.
Overall, trading activity remained distributed throughout the week.
Risk Management

The Risk of Ruin model displayed a probability of loss below 0.01% across the illustrated scenarios. However, these figures are model-based estimates rather than guarantees of future performance.
Importantly, October’s growth chart also showed a substantial difference between realized growth and equity growth. This highlights the need to monitor floating losses, position exposure, and drawdown alongside closed-trade profitability.
Trade Duration Insights
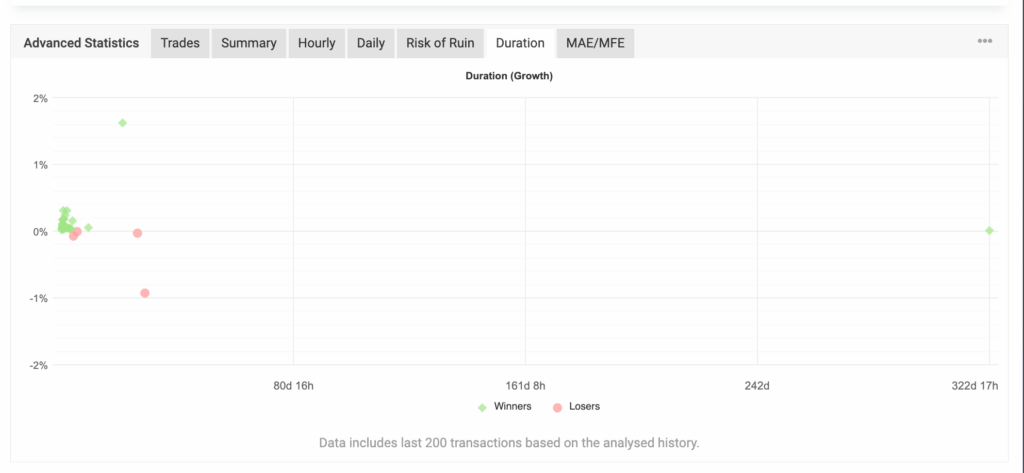
The duration chart shows that most completed trades were concentrated within shorter holding periods, with an average trade length of 12 days. Some positions remained open significantly longer, reflecting the strategy’s use of extended holding periods when managing trades.
Although many positions closed profitably, longer holding periods can increase exposure to market movements and changing economic conditions.
Monthly Analytics Breakdown
October’s currency distribution showed that GBPUSD led trading activity with 38.9%, followed by NZDUSD at 19.4%. The remaining activity was distributed as follows:
- AUDUSD: 13.9%
- USDCHF: 13.9%
- USDCAD: 8.3%
- EURUSD: 5.6%
Reward-to-risk ratios were highest on GBPUSD at 5.95 and NZDUSD at 2.16, while the other displayed pairs recorded ratios of approximately 1:1.
The holding-time data also shows that NZDUSD positions were held the longest on average, with predominantly short exposure. Other currency pairs generally displayed shorter average holding periods.
Final Thoughts
October 2026 delivered another positive closed-trade result for FGP1. A +3.30% monthly gain, 504.1 pips, and an 89% win rate demonstrated the strategy’s ability to generate realized profits across multiple forex pairs.
Nevertheless, the negative equity growth shown during October reinforces an important distinction: profitable closed trades do not eliminate the risks associated with open positions.
As always, our focus remains on long-term performance, transparent reporting, responsible risk management, and providing independently tracked trading results.
Risk Disclosure: Forex trading involves substantial risk, including the possible loss of principal. Automated trading strategies can experience significant drawdowns and extended periods of unrealized losses. Past performance does not guarantee future results. Reported gains and statistics reflect the account and reporting methodology shown and may not represent individual investor returns after applicable fees.