Geographic Restriction & Risk Notice
FGP1 is geographically restricted and is not available to U.S. persons or residents. Trading involves substantial risk, including possible loss of principal. Past performance is not indicative of future results. This material is informational only and does not constitute investment advice, an offer, or a solicitation.
This May 2026 FGP1 performance overview reviews the month using Myfxbook performance data, monthly analytics, trade statistics, drawdown context, asset mix, and trade behavior. The purpose is to present the result clearly and responsibly, not to focus only on the headline return.
MAY 2026 AT A GLANCE
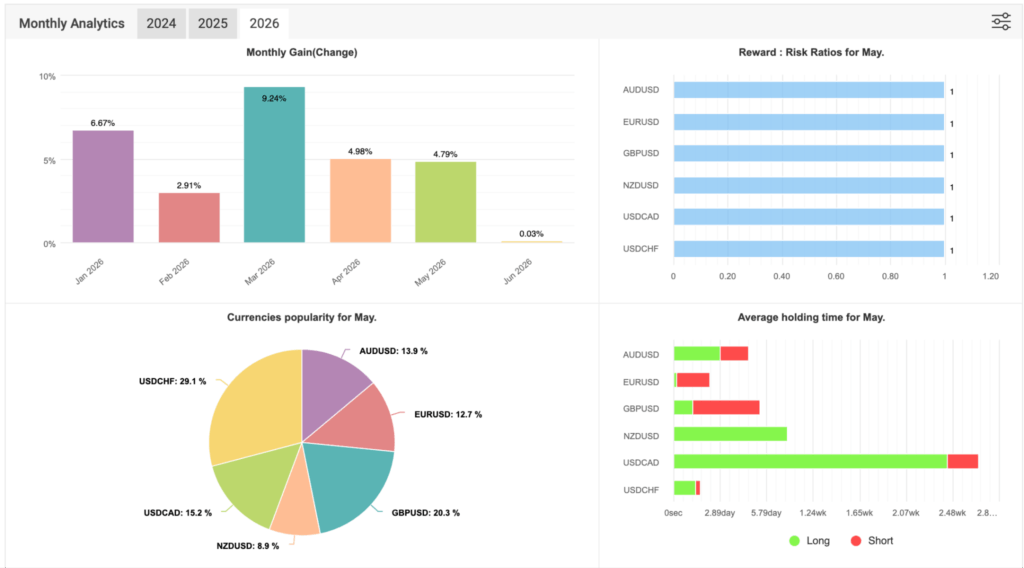
The first point to note in this FGP1 May 2026 performance overview is that the Monthly Analytics dashboard showed a 4.79% result for May 2026.
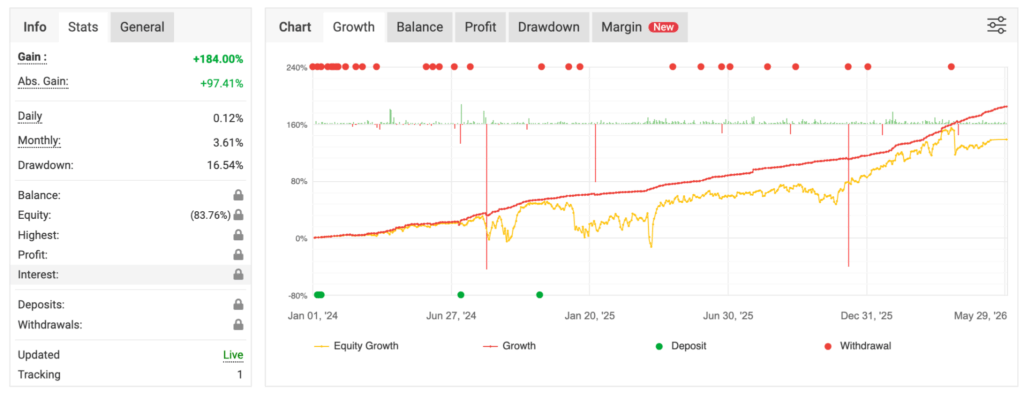
The same uploaded General panel also showed the broader account context at the time of capture:
- Gain: +184.00%
- Absolute Gain: +97.41%
- Daily: 0.12%
- Drawdown: 16.54%
That distinction matters. The May result refers to the specific month under review. By contrast, the broader gain and absolute gain reflect the larger account picture visible at the time of the screenshot.
MONTHLY PROGRESSION THROUGH MAY
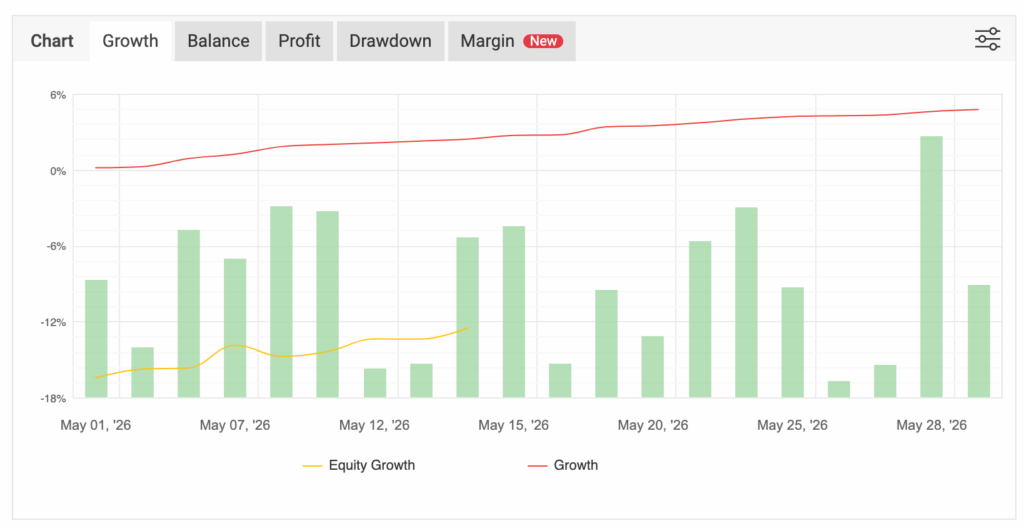
The month-specific chart views help show how May developed over time. In the uploaded May growth chart, the red growth line moved steadily higher through the month, while the yellow equity line remained more volatile. That is useful context because it reminds readers that closed performance and real-time equity movement are not always identical.
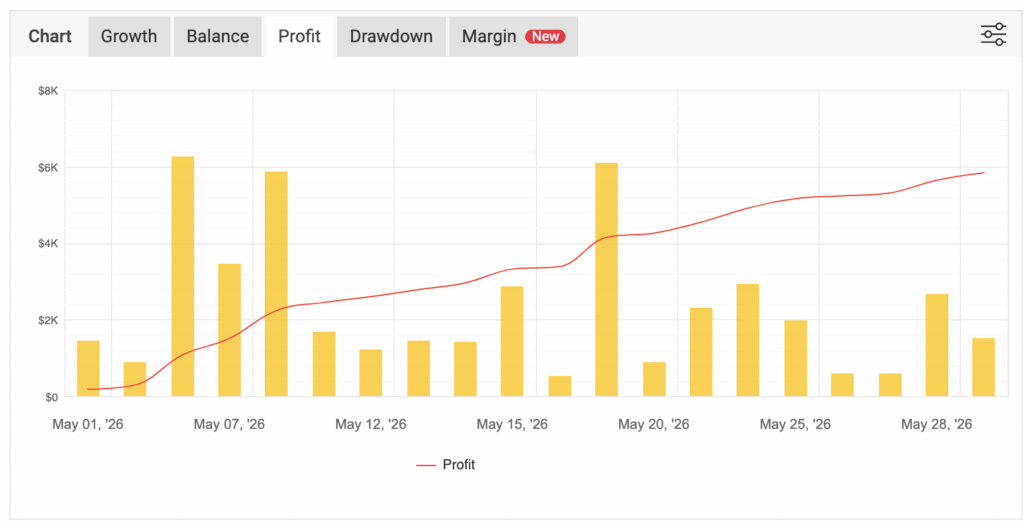
The May profit chart adds another layer. It showed cumulative profit building throughout the month, supported by multiple positive daily bars rather than a single isolated jump. That helps present May as a month built through repeated contribution rather than a single event.
In practical terms, May looked constructive in the uploaded data. However, the proper way to read it is still to do so with discipline. The result was positive, but the path still reflected the normal variation that comes with active trading.
CURRENT MAY ADVANCED STATISTICS SNAPSHOT
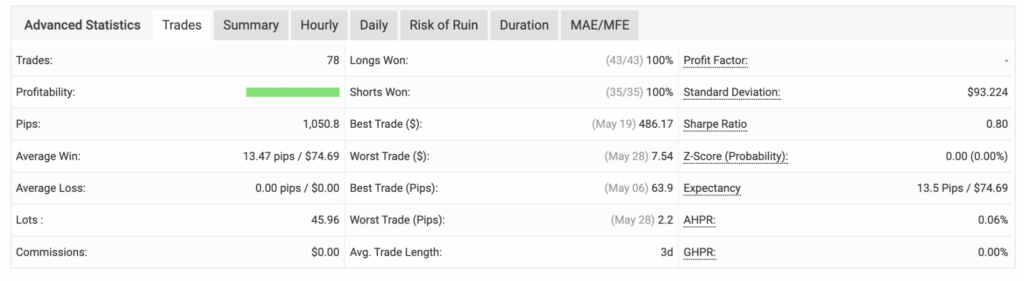
The Advanced Statistics Summary tab gives a clear month-specific snapshot for May. The uploaded Summary tab showed:
- Trades: 78
- Pips: 1,050.8
- Average Win: 13.47 pips / $74.69
- Average Loss: 0.00 pips / $0.00
- Average Trade Length: 3 days
The same Summary tab also showed:
- Longs Won: 43 / 43 or 100%
- Shorts Won: 35 / 35 or 100%
- Best Trade ($): $486.17
- Worst Trade ($): $7.54
- Sharpe Ratio: 0.80
- Expectancy: 13.5 pips / $74.69
This is one of the most notable sections in the May 2026 performance overview. The uploaded monthly sample showed no losing trades in the visible Summary tab. That helps explain why the average loss was zero and why the Profit Factor field appeared as a dash rather than a standard number.
That should still be described carefully. It does not mean the strategy is risk-free. It simply means that, in the uploaded May sample, the visible monthly outcomes were uniformly positive.
PAIR-LEVEL CONTRIBUTION IN MAY
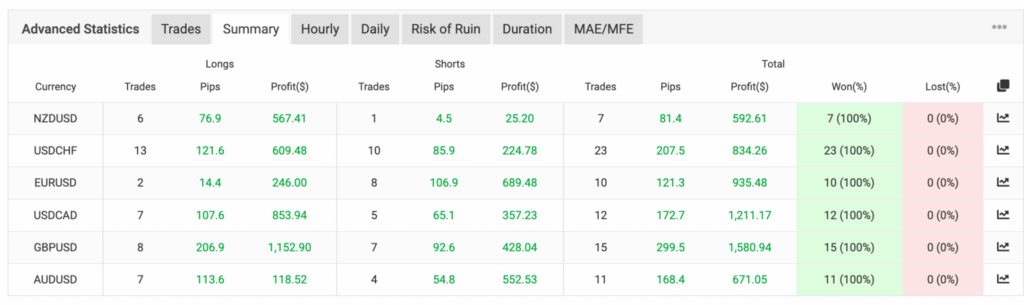
The Trades tab gives a pair-by-pair view of how May was built. This is especially useful because it shows whether the month depended on one market or whether performance was distributed across several traded pairs.
In the uploaded May Trades tab, the visible total profit contribution by pair was led by:
- GBPUSD
- USDCAD
- EURUSD
- USDCHF
The screenshot also showed positive contributions from:
- AUDUSD
- NZDUSD
This is an important detail because it shows that May was not dependent on a single market. Instead, the uploaded trade history showed constructive contribution across multiple major forex pairs. That broader distribution adds useful context for the month and helps readers understand that the visible result was supported across the pair mix rather than concentrated in a single area.
MAY 2026 ASSET MIX AND MONTHLY ANALYTICS
The Monthly Analytics dashboard gives the clearest month-specific breakdown in the uploaded set. For May 2026, the dashboard showed a 4.79% monthly result and a Reward: Risk reading of 1 across the listed pairs in the visible analytics.
The dashboard also showed the May asset popularity mix led by:
- USDCHF
- GBPUSD
- USDCAD
The remaining visible share was distributed across:
- AUDUSD
- EURUSD
- NZDUSD
This section matters because it shows how May was actually structured. In the uploaded analytics, USDCHF accounted for the largest visible share of activity, followed by GBPUSD. That helps explain how the month was distributed and gives a more accurate sense of where the strategy was most active.
AVERAGE HOLDING TIME AND TRADE DURATION
The holding-time data adds another useful layer to this FGP1 May 2026 performance overview. From the Monthly Analytics dashboard, it appears that average holding times varied by pair. Some positions were shorter, while others were clearly held longer.
The clearest example in the uploaded May dashboard was USDCAD, which showed the longest visible holding-time profile among the displayed pairs. Other pairs appeared noticeably shorter by comparison.
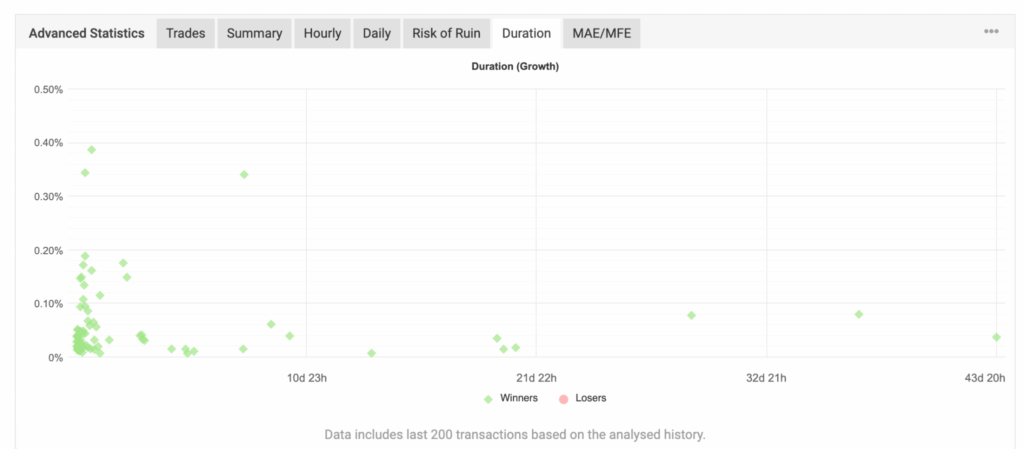
The separate Duration scatter plot supports that point. In the uploaded Duration chart, most winners clustered in the shorter-duration range, while a smaller number of outliers extended much further out in time. That matters because holding time influences how a month feels in practice. It shapes not only how long positions remain open but also how readers should understand the strategy’s behavior during the month.
HOURLY AND DAILY DISTRIBUTION
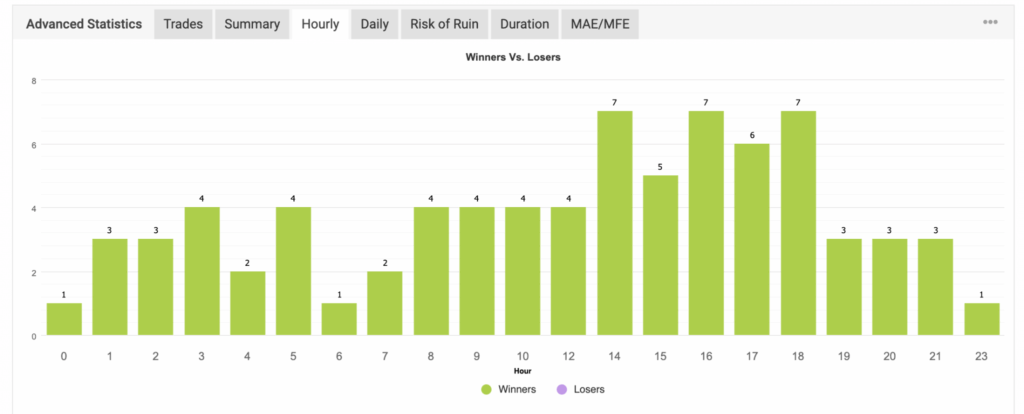
The Hourly and Daily tabs add more process context to the May report. In the uploaded Hourly view, the strongest visible activity clustered later in the trading day, with some of the highest counts occurring in the afternoon and early evening. That helps show that the visible trade activity was not evenly distributed across all hours.
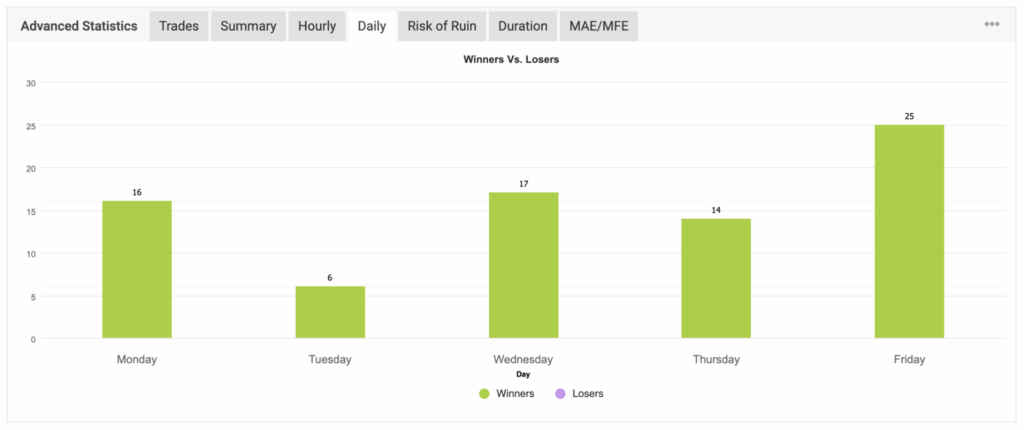
The Daily tab showed another useful pattern. In the uploaded May chart, Friday was the strongest visible day, followed by Wednesday, Monday, and Thursday, while Tuesday was the lightest of the displayed weekdays. That does not create a forecast, but it does provide one more view of how the month behaved.
These sections are valuable because they shift the report away from just outcome and toward structure. They help show when the visible results were happening, not only what the final month looked like.
RISK OF RUIN AND RISK INTERPRETATION
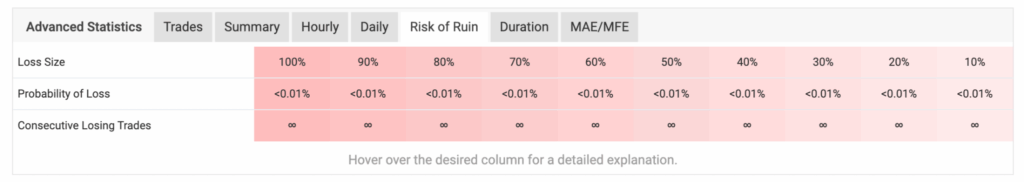
The Risk of Ruin tab is one of the more unusual screenshots in the May set. In the uploaded view, the Probability of Loss was shown as below 0.01% across all displayed loss-size thresholds. In addition, the Consecutive Losing Trades row displayed infinity symbols across the table.
That outcome is consistent with the visible May Summary and Trades views showing no losses in the uploaded monthly sample. In other words, the platform reflects a sample that did not record any losing trades during the displayed period.
Even so, these values should still be interpreted conservatively. Platform-generated risk tables can be informative, but they are not guarantees. They are model outputs based on the visible sample. Therefore, they should never be treated as a promise about future behavior.
FGP1 AND TRADITIONAL INVESTMENT TOOLS
It is also important to compare FGP1 to traditional financial tools in the right way.
Savings accounts, CDs, bonds, and index funds all serve different purposes. In general:
- Savings accounts and CDs are built around stability and capital preservation.
- Bonds carry their own market and interest-rate sensitivity.
- Index funds provide broad public market exposure over longer time frames.
By contrast, FGP1 operates in active forex trading. That means the return pattern, drawdown pattern, and account behavior can look very different from those traditional tools. Therefore, the right framing is not “better” or “worse.” The right framing is that these are simply different risk profiles.
READING MAY RESPONSIBLY
The best way to read May is to keep several facts in view at the same time:
- The Monthly Analytics dashboard showed a 4.79% result for May.
- The General panel showed 16.54% drawdown at the time of capture.
- The broader account snapshot showed a +184.00% gain and a +97.41% absolute gain.
- The visible May sample showed 78 trades and 1,050.8 pips.
- The pair breakdown showed positive contribution across all displayed pairs.
- The duration, hourly, daily, and risk sections all added useful context to the month’s structure.
When these points are read together, the month makes more sense. May was constructive in the uploaded data, but that does not remove the need for risk framing. Instead, it reinforces why complete reporting matters more than a single headline number.
What Powers These Results?
The Myfxbook screenshots above show the performance data, trade behavior, drawdown, pair activity, and account movement for FGP1.
But a natural question many readers may ask is:
What technology is being used behind the scenes?
FGP1 uses a combination of Auvoria Prime’s automated trading technology, including two of our core forex software products: Kraitos Elite and GearBox.
These tools are part of the Auvoria Prime ecosystem and are designed to help users participate in forex trading through automation, structured logic, and disciplined trade management.
For readers who are interested in the results shown above, there are two possible paths to consider.
One path is to join the FGP1 PAMM, where qualified participants can invest in a managed structure.
The other path is to purchase the software and use the technology directly through an Auvoria Prime subscription.
Kraitos Elite
Kraitos Elite is an automated forex trading software designed to identify, enter, manage, and close trades using structured strategy logic.
It is built for users who want a more automated approach to forex trading rather than sitting in front of charts looking for entries.
Kraitos Elite uses predefined trading logic, market conditions, and automated trade management to help execute a more disciplined trading approach.
This may appeal to users who want access to automation while still maintaining control over their own trading account, software setup, broker connection, and risk settings.
GearBox
GearBox is another automated forex trading software in the Auvoria Prime ecosystem.
It is designed for users who want intelligent automation, built-in trade management features, and a more hands-free way to participate in the forex market.
GearBox may appeal to people who want trading technology to work for them without having to manually analyze every chart, setup, and entry.
For users who prefer the software path over the PAMM path, GearBox may be worth considering as part of your overall automated trading setup.
FINAL THOUGHTS
This FGP1 May 2026 performance overview showed a positive month-specific result, a strong visible May trade sample, constructive pair-by-pair contribution, and a broader account profile that continued to move higher in the uploaded account context.
That is the right way to summarize the month. The result can be acknowledged. The strength of the visible sample can be acknowledged. However, the discussion should still remain disciplined from beginning to end.
For readers who value transparent reporting, that is the real purpose of this update. It is not to flatten risk. It is to present May in context.
FINAL RISK DISCLOSURE
This content is for informational purposes only and does not constitute investment advice, financial advice, or a solicitation. Trading involves substantial risk, and loss of principal is possible. Past performance is not indicative of future results, and no guarantees are made. Participation is geographically restricted and is not available to U.S. persons or U.S. residents.

FGP1 June 2026 Performance Overview
Geographic Restriction & Risk Notice FGP1 is geographically restricted and is not available to U.S. persons or residents. Trading involves substantial…

Best Day Trading App: What Traders Should Look for Before
Day trading has become more accessible than ever. With the rise of mobile technology, cloud-based platforms, and real-time market data,…

Top Stock Brokers: How to Choose the Right Platform for
Choosing from the top stock brokers can feel overwhelming. There are many platforms, account types, tools, fees, apps, and trading…

Currency Strength Meter: How Traders Use Currency Strength to Read
What Is a Currency Strength Meter? A currency strength meter is a trading tool that helps traders compare the relative strength…

Commodity Prices Today: How Traders Can Read Market Movement With
Introduction Commodity prices today can move quickly. Oil, gold, silver, copper, wheat, corn, natural gas, and other raw materials can all…
Autopilot App: A Simple Guide to Smarter Trading Automation
IntroductionWhat Is an Autopilot App?Why Traders Are Interested in Autopilot AppsHow an Autopilot App WorksAutopilot App vs Manual TradingMain Benefits…
