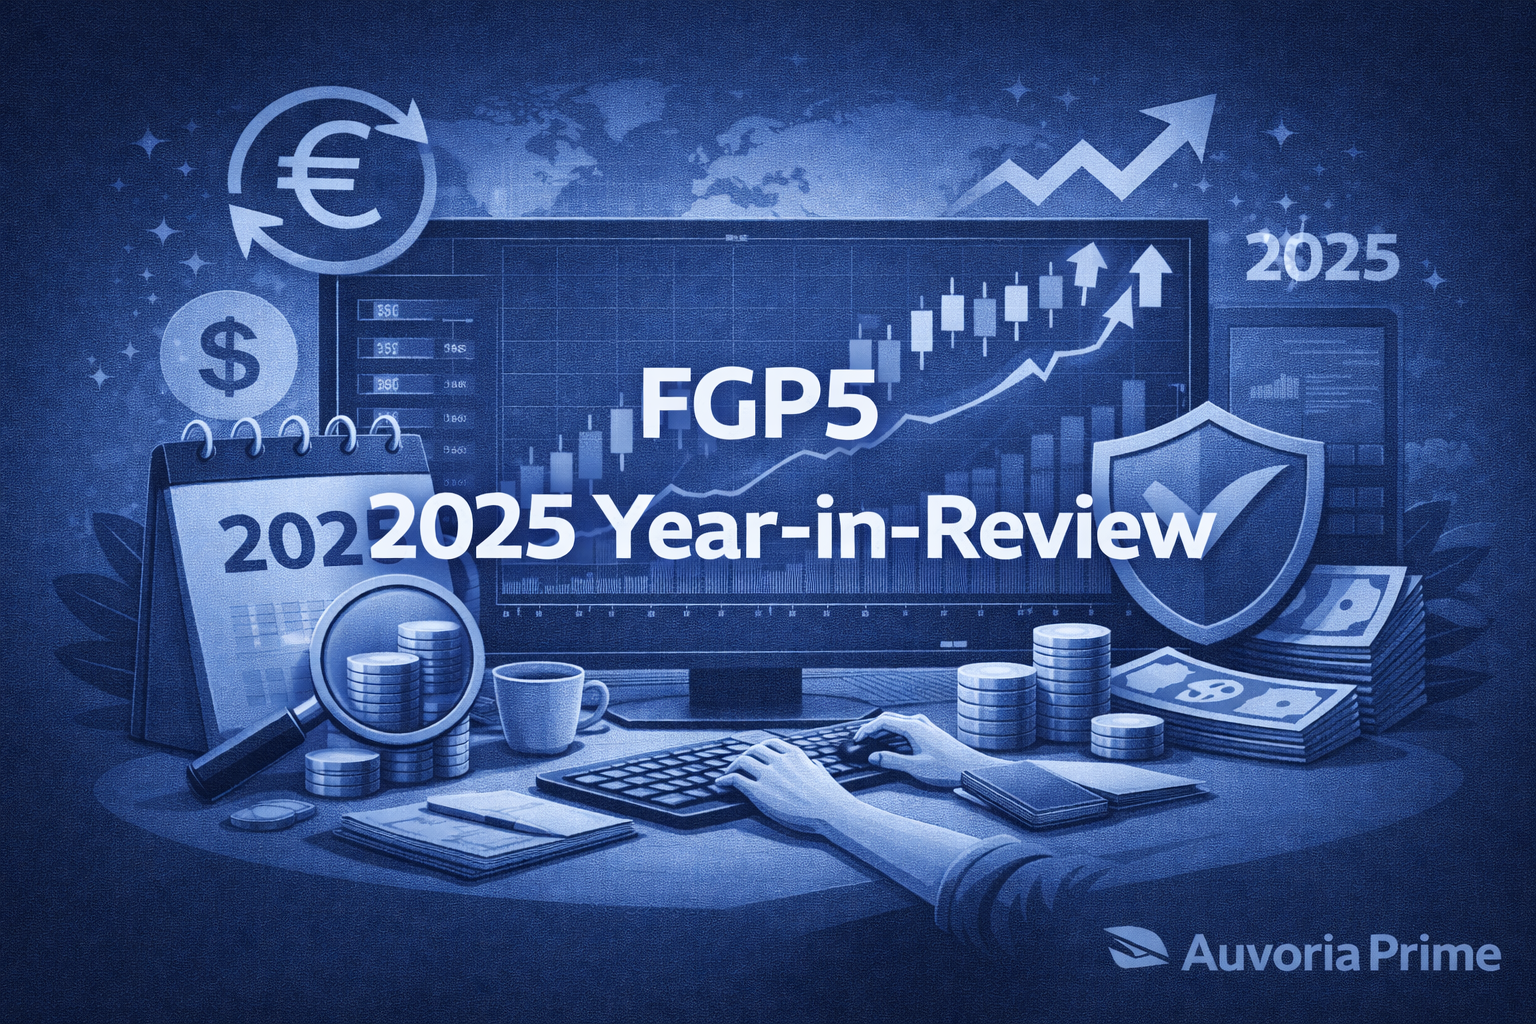

Executive summary
2025 was a materially different trading environment for most traders versus the prior regime: faster reversals, sharper risk-on/risk-off rotations, and periods where gold and major FX pairs moved with headline-driven volatility. In that backdrop, many high-leverage approaches (especially concentrated gold exposure without robust controls) experienced forced liquidations.
FGP5’s outcome was simpler and more important: it stayed intact, remained profitable across the year’s core months shown in your dashboard, and continued to behave like a resilient “capital-preservation-first” fund that still competes strongly on return.
Using the monthly “Gain (Change)” values visible in the screenshots you provided (Feb–Jul and Sep–Nov 2025), FGP5 produced:
- Average monthly gain (simple average of shown months): ~3.68%
- Best shown month: Oct 2025: +7.63%
- Second-best shown month: Apr 2025: +6.84%
- Softest shown month: Jun 2025: +0.26%
- Compounded gain across the months shown (Feb–Jul, Sep–Nov): ~+38.2%
(Note: Jan, Aug, and Dec are not included because they were not present in the screenshots provided.)
1) 2025 performance timeline (what changed through the year)
Q1: Controlled, diversified participation (Feb +3.82%, Mar +3.22%)
Early 2025 shows steady, moderate gains with a broad pair mix across AUD, CAD, CHF, EUR, GBP, NZD, USD. The “Currencies popularity” pies show activity spread across multiple crosses (notably GBPJPY and EURJPY in Feb; EURCAD/EURAUD and JPY crosses in Mar). This is typically what you want at the start of a volatile regime: diversification across drivers rather than one-market dependence.
April: Breakout month with strong asymmetry in select GBP/CAD exposures (+6.84%)
April is the first month where the Reward:Risk chart clearly differentiates pair outcomes. Standouts include:
- GBPCAD (Reward:Risk ~4.62)
- GBPNZD (~3.49)
- USDCHF (~2.79)
- AUDCAD (~2.47)
That’s a strong “asymmetry month” (more reward per unit of risk), and it aligns with the idea that FGP5 can press opportunity while still staying structurally defensive.
May: Solid gains (+3.81%) with multiple pairs showing high Reward:Risk
May’s Reward:Risk chart shows several unusually strong ratios, including:
- GBPNZD (~6.58)
- CHFJPY (~6.29)
- GBPJPY (~4.84)
- AUDCAD / CADJPY (~4.11)
- USDCHF (~3.81)
This is the profile of a portfolio that is not “one-trick”—performance is sourced from multiple instruments rather than one lucky run.
June: Defensive month (+0.26%) and a good example of “survival > speed”
June is the smallest month in the set (+0.26%), but it is also where the analytics suggest a more defensive posture:
- The pair set is narrower.
- Holding times extend, with at least one leg (EURGBP long) showing multi-week average duration.
- Reward:Risk highlights include USDJPY (~5.83) and EURGBP (~1.69), alongside at least one negative contributor (GBPUSD ~-0.31).
Months like June are where many accounts break—either by overtrading to “force” returns or by carrying excessive leverage into chop. FGP5’s result reads as discipline: smaller gain, continued stability.
July: Modest headline gain (+2.09%) with very high pair-specific Reward:Risk
July’s Reward:Risk chart includes extremely high values on:
- GBPJPY (~14.30)
- EURUSD (~12.78)
…and also shows negative contributors (e.g., AUDCAD ~-0.37, GBPUSD ~-0.66). This combination is realistic: strong opportunity capture in some lanes, losses in others, with the overall portfolio still net-positive. July also shows some of the longest holding times on the dashboard, reaching up to ~9–10 weeks on certain shorts—important for participants to understand (more on that below).
September: Clean, concentrated basket (+3.46%)
September is notable because the portfolio concentrates into a small group of pairs:
- GBPNZD (largest share on the pie at ~37.5%)
- GBPUSD (~25%)
- CHFJPY / EURJPY / EURNZD (each ~12.5%)
This is a “selectivity month”—fewer markets, clearer conviction, and a controlled return.
October: Best month (+7.63%) with heavy gold involvement
October stands out in two ways:
- Top monthly gain: +7.63%
- Currencies popularity shows XAUUSD dominating activity (~92.6%)
The key point for your recap is not “we traded gold,” but how it was traded: October also shows continued participation across certain FX pairs, and Reward:Risk ratios remain constructive (e.g., EURNZD ~3.67, AUDCAD ~2.24, AUDNZD ~2.05, XAUUSD ~1.57). In a year where gold volatility harmed many accounts, this month supports your positioning that FGP5 can engage gold without becoming fragile.
November: Tactical, short-duration execution (+2.03%)
November narrows further into just a few markets (AUDJPY, AUDNZD, EURJPY). Average holding time compresses to roughly a week-scale duration, consistent with a tactical approach during changing conditions. Reward:Risk includes AUDNZD ~-0.18 alongside AUDJPY and EURJPY at ~1, which again reads as a controlled month rather than an overreach month.
2) What “Reward:Risk”, “Popularity”, and “Holding Time” tell a participant (the practical implications)
Reward:Risk ratios (pair-level efficiency)
- When Reward:Risk expands materially (>2, >4, >6), it usually indicates cleaner conditions for that instrument and/or that the strategy parameters aligned well to that month’s volatility structure.
- Negative values highlight a critical reality: not every pair contributes every month, which is exactly why you diversify and manage exposure rather than betting the fund on one instrument.
Currency (pair) popularity (where activity clustered)
- Early months show broad diversification across multiple crosses.
- Later months show intentional concentration (Sep’s five-pair basket; Oct’s XAUUSD dominance).
- Participants should understand that “popularity” reflects trade activity distribution, not necessarily the exact capital weighting, but it is still a strong proxy for what the strategy emphasized.
Average holding time (patience requirement and drawdown tolerance)
Across 2025, holding time ranges from seconds/days to multiple weeks, and in July the scale reaches ~9–10 weeks on some positions. That means:
- The fund can hold trades through extended mean-reversion windows.
- Floating drawdown is possible even in profitable months, because some positions are designed to resolve over time.
- This is not “set it and forget it for a week.” It’s a strategy that expects participants to be comfortable with multi-week trade lifecycles when the market demands it.
3) How FGP5 compared against other funds/strategies in your ecosystem
Within your broader lineup, FGP5 generally sits as a strong contender in the “balanced return with survivability” lane—not the most aggressive, and not the most conservative.
One concrete reference point you’ve previously provided:
- September 2025: FGP5 +3.46% vs Social Trading FGP1 +2.04% (FGP5 ahead in that month), while some product strategies showed different profiles (e.g., KraitosX was materially higher in that snapshot, but that style typically carries a different risk/volatility signature).
The practical comparison message for prospects is:
- FGP5 is designed to stay standing through regime shifts and volatility spikes.
- It may not always lead the leaderboard in a single “risk-on” month, but it is built to avoid the common failure mode of high-leverage funds: one bad volatility event wiping out months or years of gains.

4) The 2025 “regime shift” message
2025 delivered a different volatility character—especially around macro and policy-driven headlines—where both FX and gold saw sharp dislocations and faster reversals than many systems were tuned for. In that environment, over-optimized, over-leveraged accounts frequently faced margin stress, and gold in particular punished traders who treated it like a smooth trend market.
FGP5’s defining accomplishment is that it remained profitable and operationally intact through that turbulence. Even if 2025 finished below the pace of the prior year (as you noted), it still stacks up as a credible, resilient performer versus the broader universe of funds that struggled or failed in comparable volatility.
5) Closing takeaway for prospective participants
If someone is evaluating FGP5, they should understand what they’re opting into:
- A strategy that adapts its emphasis (broad diversification early-year, selectivity later-year, and opportunistic gold engagement when conditions justify it).
- A strategy that can hold positions for weeks, which requires patience and appropriate expectations.
- A fund built around the principle that the first job is survival, and the second job is compounding.
Participation may be restricted by jurisdiction, and prospective participants should contact your team to confirm eligibility and to review the most current performance reporting and risk parameters.
Disclaimer
This recap is for informational and educational purposes only and does not constitute investment advice, financial advice, or an offer/solicitation to buy or sell any securities, managed account services, or financial products. Trading in foreign exchange, gold (XAUUSD), and leveraged instruments involves substantial risk, including the possible loss of all capital, and is not suitable for all individuals. Past performance (including any monthly results referenced) is not indicative of future results. Performance figures may differ across brokers, pricing, spreads, execution, liquidity conditions, and account configurations. Always conduct independent due diligence and consult qualified professionals before making any financial decision. Participation may be limited or prohibited in certain jurisdictions.

FGP1 June 2026 Performance Overview
Geographic Restriction & Risk Notice FGP1 is geographically restricted and is not available to U.S. persons or residents. Trading involves substantial…

Best Day Trading App: What Traders Should Look for Before
Day trading has become more accessible than ever. With the rise of mobile technology, cloud-based platforms, and real-time market data,…

Top Stock Brokers: How to Choose the Right Platform for
Choosing from the top stock brokers can feel overwhelming. There are many platforms, account types, tools, fees, apps, and trading…
Currency Strength Meter: How Traders Use Currency Strength to Read
What Is a Currency Strength Meter? A currency strength meter is a trading tool that helps traders compare the relative strength…

Commodity Prices Today: How Traders Can Read Market Movement With
Introduction Commodity prices today can move quickly. Oil, gold, silver, copper, wheat, corn, natural gas, and other raw materials can all…
Autopilot App: A Simple Guide to Smarter Trading Automation
IntroductionWhat Is an Autopilot App?Why Traders Are Interested in Autopilot AppsHow an Autopilot App WorksAutopilot App vs Manual TradingMain Benefits…
